Display Top-N Values
- 6 minutes to read
This document describes how to aggregate series points with small values into a single point or exclude these points from the chart. This cumulative point (when visible) behaves like an ordinary point (for example, you can expand it or display it in a Legend with custom text). Note the series point collection is not affected - only the chart’s appearance changes.
Limitations
The Top-N feature is only in effect for a series whose data points contain one value. This value is used to determine which points are shown. The Top-N feature is not available for series whose view type implies more than one value (for example, in a Stock or Bubble chart).
If a series contains data points with negative values, their absolute values are taken in account when calculating which points are visible within the chart.
Use SummaryOptionsBase.SummaryFunction instead of XYDiagram2DSeriesViewBase.AggregateFunction with the Top-N feature enabled. Top-N merges the series points before
AggregateFunctionis applied.
How to Use
To enable the Top-N feature, access the SeriesBase.TopNOptions property and set the TopNOptions.Enabled property to true. Then, set the TopNOptions.Mode property to select the criteria used to group points in a cumulative point. The available modes are described below.
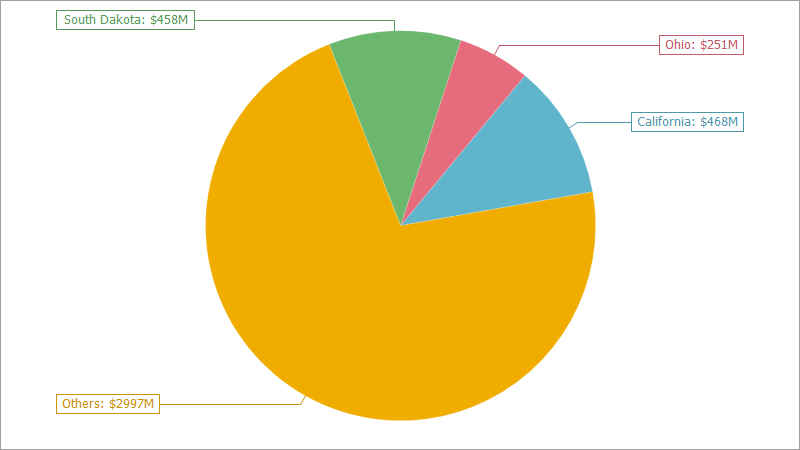
Count
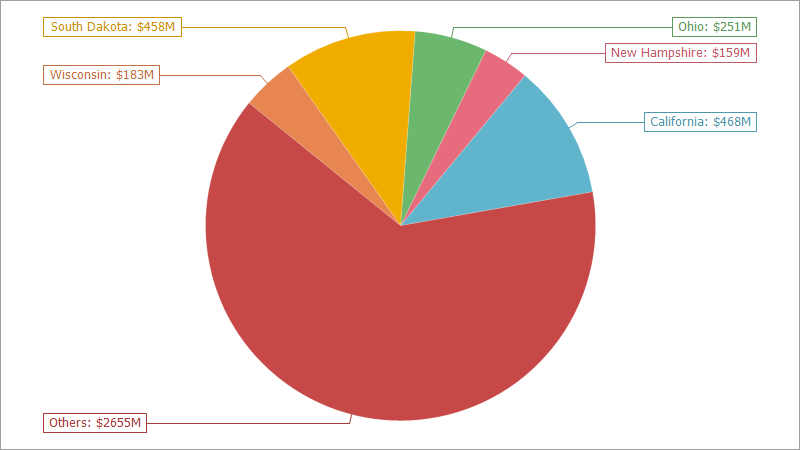
In this mode, only first N points with the largest values are visible. Use the TopNOptions.Count property to limit the number of visible points. Other values are aggregated in a cumulative point.
Series series = chartControl1.Series[0];
series.TopNOptions.Enabled = true;
series.TopNOptions.Mode = TopNMode.Count;
series.TopNOptions.Count = 5;
series.TopNOptions.ShowOthers = true;
series.TopNOptions.OthersArgument = "Others";
Result:
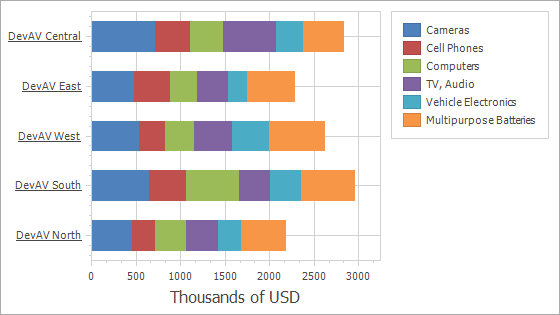
For Bar, Line and Area stacked views, Top-N values are selected for each stacked series independently. So, a set of values displayed for each argument can be different.
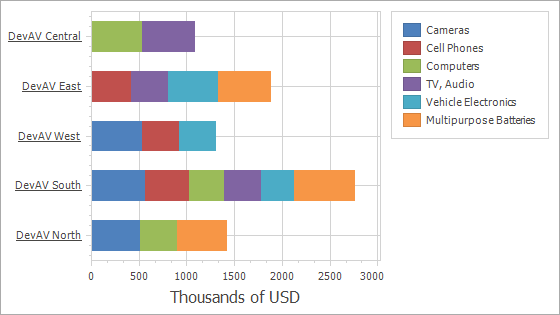
The table below shows how this mode works for a Stacked Bar Chart with each series TopNOptions.Count property set to 3.
Property Values | Resulting Image |
|---|---|
TopNOptions.Enabled = false |
|
TopNOptions.Enabled = true TopNOptions.Count = 3 |
|
ThresholdValue
When this mode is enabled, you define the value threshold that points need to overcome so that they are not included in the cumulative point. Use the TopNOptions.ThresholdValue property to set the threshold.
Series series = chartControl1.Series[0];
series.TopNOptions.Enabled = true;
series.TopNOptions.Mode = TopNMode.ThresholdValue;
series.TopNOptions.ThresholdValue = 100;
series.TopNOptions.ShowOthers = true;
series.TopNOptions.OthersArgument = "Others";
Result:
ThresholdPercent
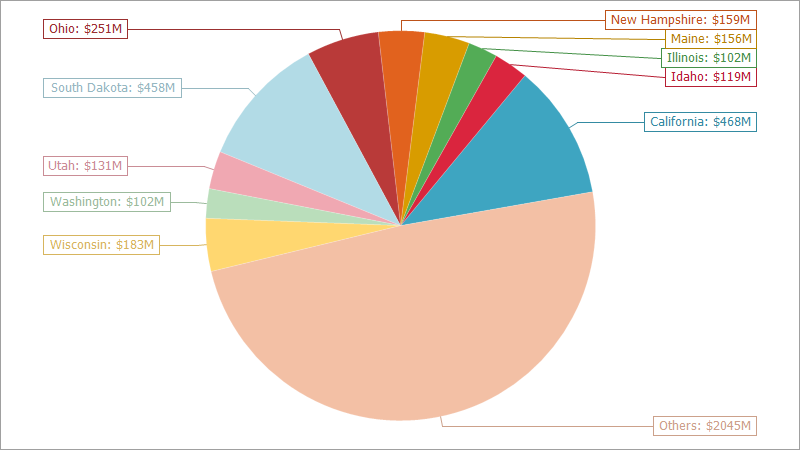
In this mode, use the TopNOptions.ThresholdPercent property to specify the threshold as percentage. The sum of all point values in the series is considered as 100%. A point is included in the cumulative point if the point’s value is less than the ThresholdPercent of the sum.
Series series = chartControl1.Series[0];
series.TopNOptions.Enabled = true;
series.TopNOptions.Mode = TopNMode.ThresholdPercent;
series.TopNOptions.ThresholdPercent = 5;
series.TopNOptions.ShowOthers = true;
series.TopNOptions.OthersArgument = "Others";
Result:
Show the Others Point
To show the cumulative point, enable the TopNOptions.ShowOthers property.
If values are represented as percentages (either in series point labels or in the legend), the cumulative point value is not taken into account. The following image illustrates this:
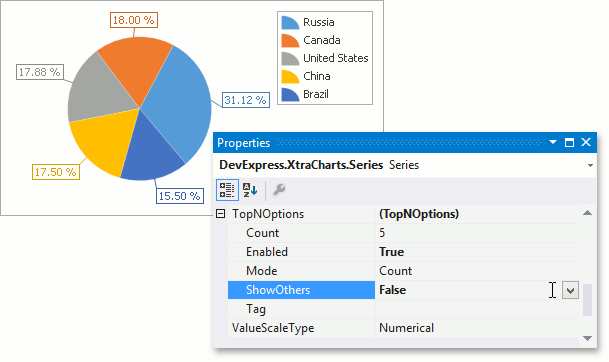
If the TopNOptions.ShowOthers is enabled and arguments are included in the legend item and series label text patterns, the cumulative point is displayed in the legend and series label with the Others argument. You can use the TopNOptions.OthersArgument property to change the argument displayed for the cumulative point.
Series series = chartControl1.Series[0];
//...
series.TopNOptions.ShowOthers = true;
series.TopNOptions.OthersArgument = "Other Values";
To explode the cumulative point in a Pie or Doughnut chart, set the PieSeriesViewBase.ExplodeMode property to Others.
Select Top N Values from Series Generated Using Template
When series are generated from a data source based on a template, you can specify Top-N options that are applied to all created series:
chartControl1.SeriesTemplate.TopNOptions.Enabled = true;
chartControl1.SeriesTemplate.TopNOptions.Mode = TopNMode.Count;
chartControl1.SeriesTemplate.TopNOptions.Count = 5;
chartControl1.SeriesTemplate.TopNOptions.ShowOthers = true;
chartControl1.SeriesTemplate.TopNOptions.OthersArgument = "Others";
To select Top N values from a specific series only, access this series in the ChartControl.BoundDataChanged event handler:
chartControl1.BoundDataChanged += ChartControl1_BoundDataChanged;
//...
private void ChartControl1_BoundDataChanged(object sender, EventArgs e) {
    Series series = chartControl1.Series[0];
    series.TopNOptions.Enabled = true;
    series.TopNOptions.Mode = TopNMode.Count;
    series.TopNOptions.Count = 5;
    series.TopNOptions.ShowOthers = true;
    series.TopNOptions.OthersArgument = "Others";
}
To select Top N values that are summaries of point values from multiple series, specify the AxisBase.QualitativeScaleComparer to rearrange points according to their summary values as described in the example:
void ChartControl1_BoundDataChanged(object sender, EventArgs e) {
    Series series = chartControl1.Series[0];
    var argTotalDict = new Dictionary<string, double>();
    for (int i = 0; i < ArgumentNumber; i++) {
        string argument = series.Points[i].Argument;
        double total = GetTotalByArg(argument);
        argTotalDict.Add(argument, total);
    }
    AxisX axisX = ((XYDiagram)chartControl1.Diagram).AxisX;
    axisX.QualitativeScaleComparer = new ArgumentByTotalComparer(argTotalDict);
}
double GetTotalByArg(object arg) {
    double total = 0;
    foreach (Series series in chartControl1.Series)
        foreach (SeriesPoint point in series.Points)
            if (Equals(point.Argument, arg))
                total += point.Values[0];
    return total;
}
Then limit the number of visible points.
void ChartControl1_BoundDataChanged(object sender, EventArgs e) {
    //...
    XYDiagram diagram = (XYDiagram)chartControl1.Diagram;
    // In this example, "top 5" summary points are displayed
    string min = diagram.AxisX.GetScaleValueFromInternal(series.Points.Count - 5).ToString();
    // Gets the last point's argument.
    string max = diagram.AxisX.GetScaleValueFromInternal(series.Points.Count).ToString();
    diagram.AxisX.VisualRange.SetMinMaxValues(min, max);
}