Series Points
- 3 minutes to read
This document describes the general concepts of series data points. For a detailed tutorial, refer to Manually Add Points to a Series.
A series point is a visual interpretation of a data point of the series, representing the data point’s argument and value in a chart’s diagram as the X and Y coordinates, respectively. To learn more about a data point’s argument and value, refer to Understanding a Data Point, Its Argument and Its Value.
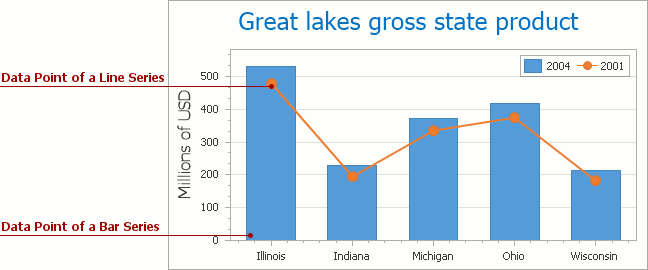
The visual representation of a series point varies depending on the view type of the series, as does the set of the available appearance options, which differ, according to the view. The following image demonstrates a series points implementation for two series of different view types.
To be displayed in a chart, a series should possess at least one data point, with at least one argument and its value(s) defined. The defined scale type should be appropriate for the argument and value data members. Four scale types are available: the numeric, date-time and time-span are applicable both to point values and for arguments, and for arguments only - the special qualitative scale type. Each scale type has its own requirements and promotes a specific functionality. To learn more, refer to Series Scale Types.
Note
The sequence in which series points are drawn corresponds to the order they have in the collection. However, data bound series may expose a more sophisticated drawing sequence (especially when complicated data bindings are involved, or events like ChartControl.BoundDataChanged are handled, and when the qualitative scale type is used). In such situations, if it’s required that series points are drawn in a strictly determined sequence, this can be achieved by adding a static series with points arranged in the required way, and setting this series as the first item in the collection.
Series points can be created and populated either manually (being added to the collection returned by the Series.Points property), or automatically (based on a predefined template, under which they obtain data from a chart’s data source, and get their appearance). For details on using these approaches, refer to Providing Data.
Series points can be accompanied with textual labels and annotations.
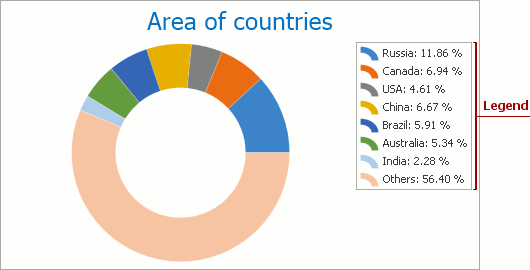
Typically, a chart’s legend refers to the chart’s series. However, it’s possible to make the legend display a series points as well. As with series points labels, you can show a point’s arguments, values, or both.
Typically, series points are automatically sorted by their arguments. This means that a series’ points are not represented in the same order in which they appear in the collection. With respect to a series’ argument scale type, series points are sorted (in ascending order, by default), so that points having equal arguments are aggregated under the same value on the X-axis . A sole exception is the Scatter Line series view type, whose distinctive feature is that points are inter-connected by lines in the same sequence they have in the points’ collection.