Diagram
- 4 minutes to read
This section details the purpose, implementation and capabilities of a diagram in XtraCharts. Prior to reading this document, it may be useful to review the basic concepts of XtraCharts, which are described in the following document: Getting Started.
This document consists of the following sections.
Overview
The diagram is one of the most basic chart elements, along with series, chart titles and the legend. Architecturally, the diagram is a parent for chart panes and axes, and visually - it encloses a chart’s series as well. Despite the fact that series don’t formally belong to the Diagram object (instead, they reside in the ChartControl’s SeriesCollection), they’re strongly interdependent with the diagram’s type (details on this appear further on in this document), and are visually displayed within the diagram’s bounds. To view the XtraCharts architecture schematically, refer to Chart Elements.
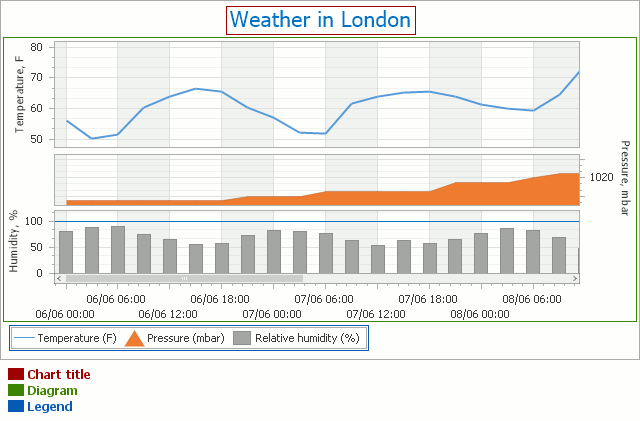
Note that it’s only possible to have a single diagram object for each chart. However, within the same diagram (of the XY-Diagram 2D type), you can plot multiple panes as shown in the image above. For details, refer to Panes.
The diagram’s most significant characteristic is its type. The type of the diagram depends on the view type of the chart’s series. By default, it’s automatically determined by the view type of the first visible series in the chart’s collection. Note that the Diagram object is equal to null (Nothing in Visual Basic) until a chart has at least one series in its collection.
Thus, a diagram of each type can only display series of the appropriate view types, and it’s impossible to plot multiple series of incompatible view types within the same Diagram object (and therefore, within the same chart). To learn more about this, refer to Series View Compatibility.
In addition, for each diagram type, there is a unique set of available options and elements.
Diagram Types
In the following list, the available diagram types are broken into several basic categories. For specific details on each diagram type, refer to the appropriate document.
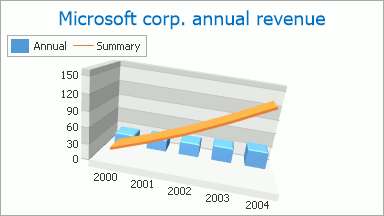
| Simple Diagram | Simple Diagram 3D |
|---|---|
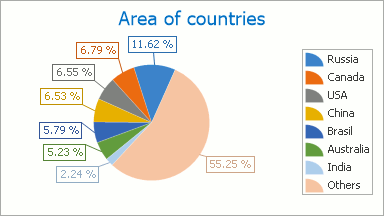 |
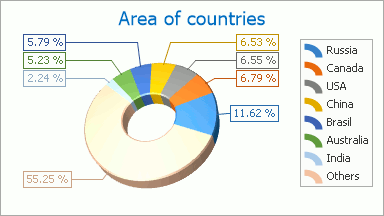 |
| XY-Diagram | XY-Diagram 3D |
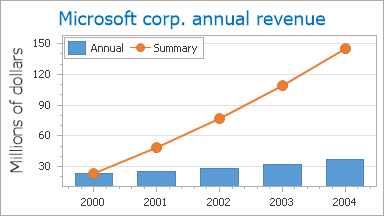 |
 |
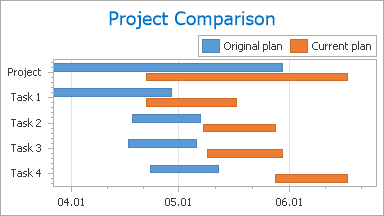
| Gantt Diagram | Funnel Diagram 3D |
 |
 |
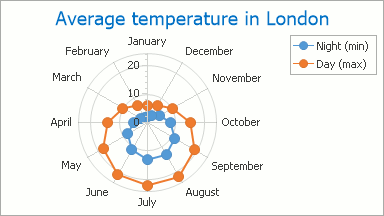
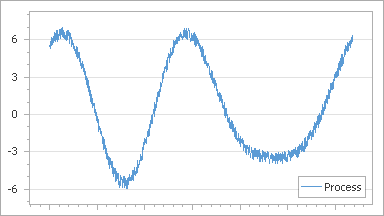
| Radar and Polar Diagrams | Swift Plot Diagram |
 |
 |
To access almost any of the chart’s elements (excepting its series, titles and legend), you should first access the diagram itself. How this is done (both at design and runtime) is briefly described in the following section of this document: Accessing the Diagram.
Accessing the Diagram
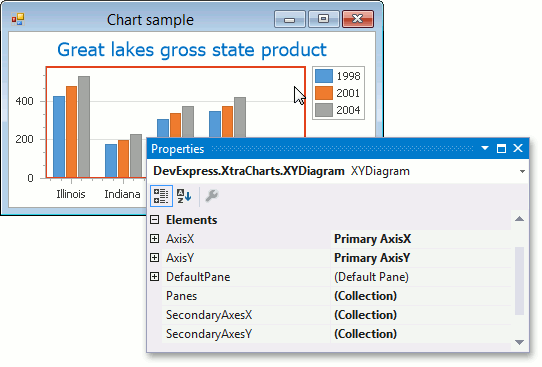
To access the diagram at design time, click on the diagram in the chart control to select it. Then, properties of the current diagram type will be displayed in the Properties window.
At runtime, a diagram is represented by an instance of the Diagram class, which can be accessed with the ChartControl.Diagram property. To access diagram elements and properties, cast your diagram’s instance to the specific diagram’s type, as the following example demonstrates.
XYDiagram diagram = chart.Diagram as XYDiagram;
if (diagram != null) {
    // Access diagram properties, for example, rotate the diagram.
    diagram.Rotated = true;
    // Access properties of objects that belong to the diagram,
    // for example, axes and panes.
    diagram.AxisY.Title.Text = "Population mid-year, millions";
    diagram.DefaultPane.Weight = 2;
}
Note that if the diagram type to which you cast your diagram object isn’t appropriate (e.g., it has series of incompatible view types), an exception will be thrown.
Diagram Elements
Architecturally, the diagram is a parent for chart panes and axes. And each diagram has the default pane and axis of arguments and axis of values.
And for an XY-diagram, secondary axes and additional panes can be added.
For more information about diagram elements, refer to one of the following topics.