How to: Show N Top Points as a Single Section in a Pie Chart
- 2 minutes to read
This tutorial demonstrates how to show a number of series points as an aggregation. In this example - as a single slice of a Pie chart. It’s the so-called Top N feature, which is intended to visually represent selected points of a series as a single point.
To learn how the “Top N” feature can be used, do the following.
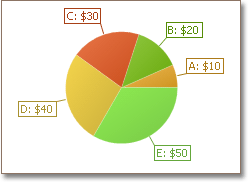
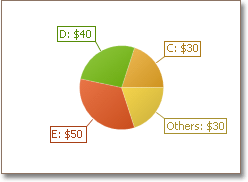
Create a simple unbound chart of the PieSeriesView type. For this example, we’ll use the chart created for the following tutorial: How to: Change the Display Format for Series Labels of a Pie Chart. It is shown in the following image.
The following steps demonstrate how to aggregate some of the Pie series points into a single slice.
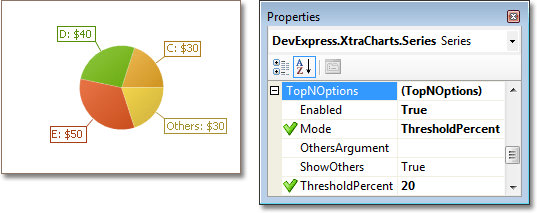
Select the Pie series, and in the Properties window, expand its SeriesBase.TopNOptions property. Then, set the TopNOptions.Enabled property to true.
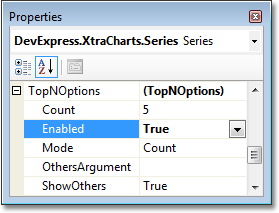
Now, the available options are visible. They are briefly described below.
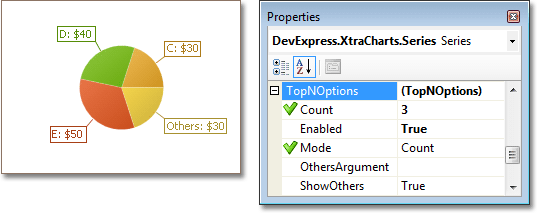
The key option is the TopNOptions.Mode property, which allows you to choose from three different modes in which the TopN feature can be implemented:
Count
This setting determines that the defined number of series points should be aggregated into the single slice.
After you set the TopNOptions.Mode property to Count, define the number of series points not to be aggregated, via the TopNOptions.Count property. The result is shown in the following image.
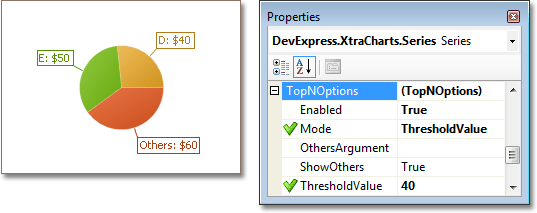
ThresholdValue
This setting determines that series points are aggregated into a single slice, if their values exceed the threshold value, determined by the TopNOptions.ThresholdValue property.
ThresholdPercent
This setting determines that series points are aggregated into a single slice, if their values exceed a certain percentage threshold, relative to the series points’ overall value. The TopNOptions.ThresholdPercent property determines the threshold percent.
Note
You can completely exclude the aggregated points from the chart, by disabling the TopNOptions.ShowOthers property.
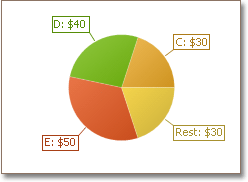
To customize the text of the argument, which is shown instead of the real points’ arguments, use the TopNOptions.OthersArgument property. The following images demonstrate how this property works.
| OthersArgument isn’t defined (default) | OthersArgument = “Rest” |
|---|---|
 |
 |