Lesson 2 - Create a Chart using the Chart Designer
- 2 minutes to read
This tutorial introduces the Chart Designer, which allows you and your end-users to create and customize a chart of any level of complexity from scratch. In this example, we’ll use the Chart Designer to create a simple unbound chart. However, note that if your chart’s ChartControl.DataSource is defined, the Chart Designer also provides a complete set of data-related settings, so that you can use it to perform even the most complex data binding tasks.
This tutorial consists of the following steps.
Overview
By default, the Chart Designer is automatically invoked each time a ChartControl is dropped from the toolbox (if the “Display a wizard every time a new chart is added” option on the Chart Designer’s status bar is enabled). And you can quickly run the Chart Designer for your chart by clicking its smart tag, and from its actions list, choose the Run Designer… command.
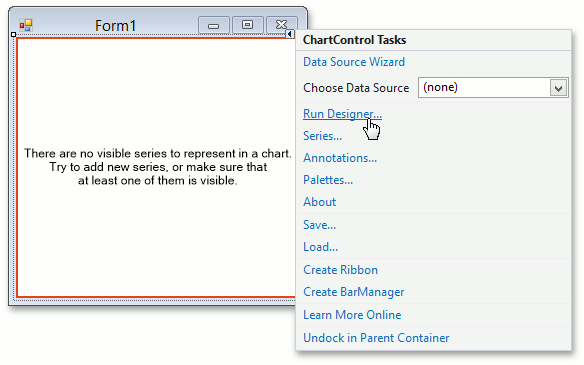
Chart Customization
Then, configure a chart using the Chart Designer.
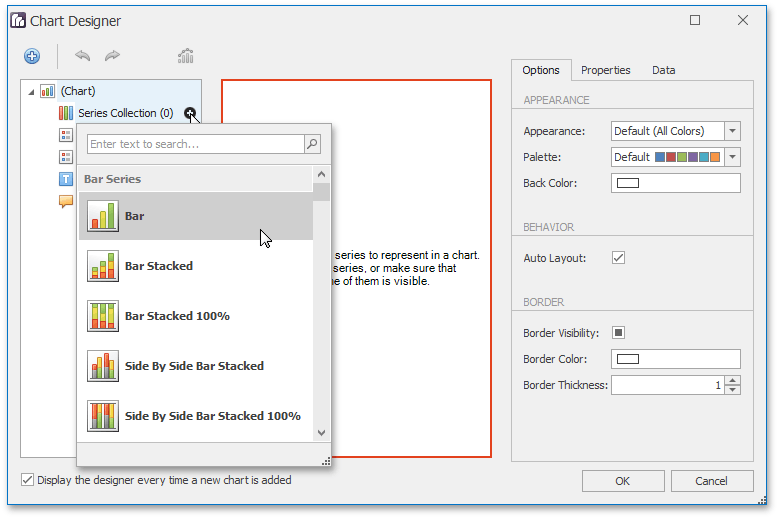
The first step is adding a new Series to the Chart Control. For this, locate the Series Collection element in the chart elements tree and click the (+) button. In the invoked list of series types, select the Bar type.
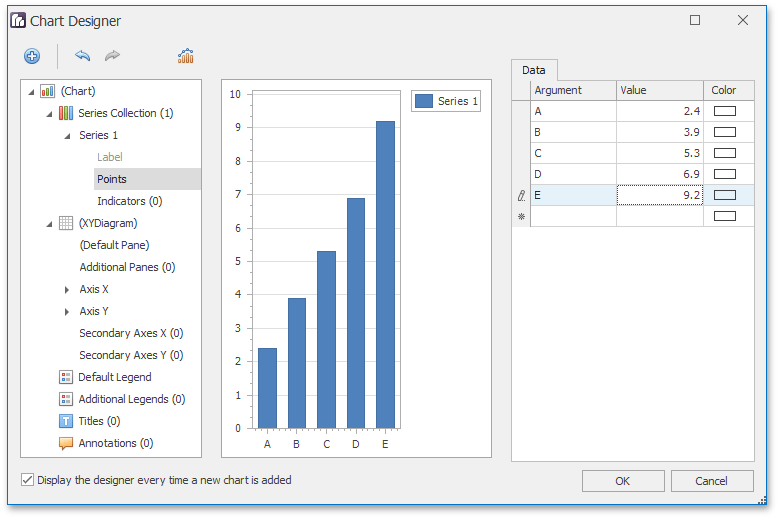
Then, populate the series with points. This can be either done manually (by specifying arguments and their values for each point) or - if your chart’s data source is defined - automatically (by specifying the data bindings for your series). For details on this, refer to Providing Data.
Currently, populate points manually. To do this, expand the Series 1 element in the Series Collection subtree and select the Points element. Then, add all required arguments and values, for instance, as shown in the image below.
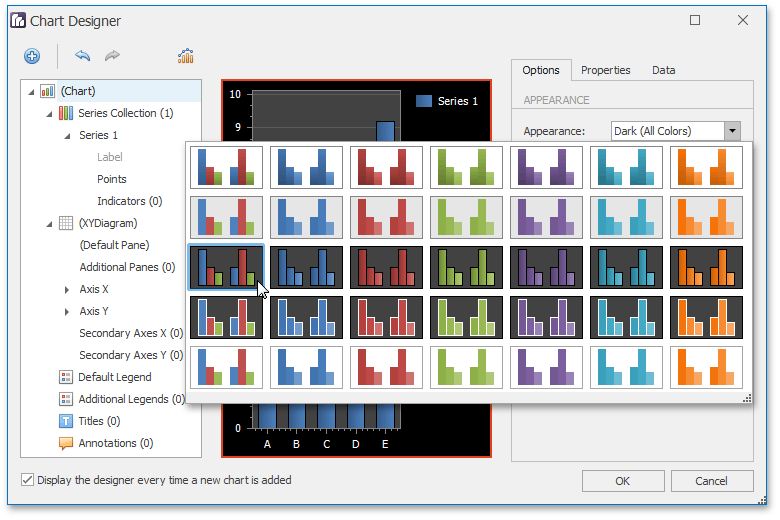
Customize the Chart Control’s and series’ appearance. For this, select (Chart) in the element tree, and in the Options tab, configure the Appearance option of the chart control. Set the Appearance to Dark (All Colors).
Then, specify the Office 2013 value to the Palette option.
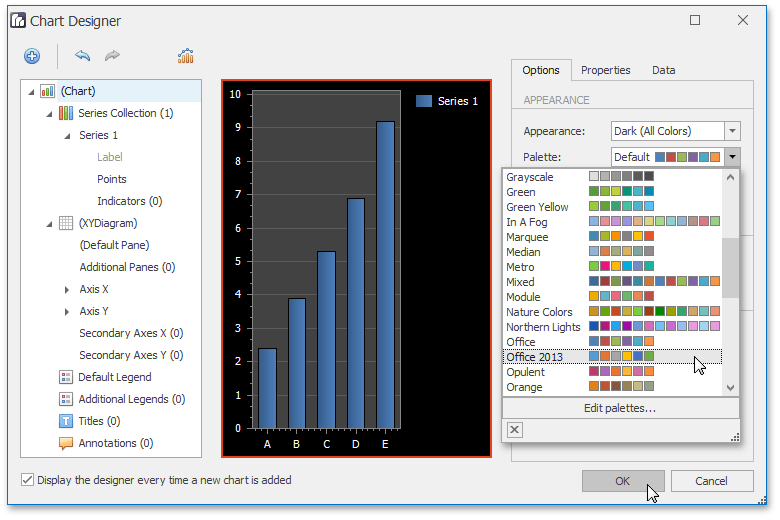
Now the chart control customization is finished. Click OK to perform changes and close the Designer.
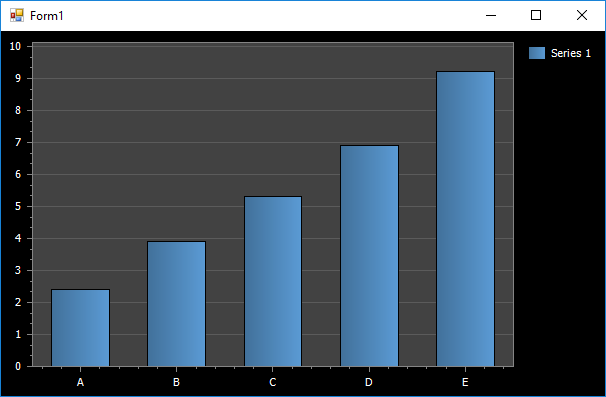
Result
Run the application to see the results.