Simple Diagram 3D
- 5 minutes to read
This document details the specifics of the Simple diagram 3D type. It lists the series view types associated with this diagram type, demonstrates how its specific options can be accessed (both at design and runtime), and briefly describes these options. Before reading this text, you may wish to review the basics of using diagram in XtraCharts.
This document consists of the following sections.
Associated Series View Types
In addition to a wide range of 2D chart types, with XtraCharts it’s possible to build most of these charts in an attractive and high-resolution 3D-like style. Also, the smart rotation feature enables you to adjust the 3D position of your chart via the mouse pointer, both at design time and runtime. So, with the Simple diagram 3D type, you can plot series of the Pie 3D and Doughnut 3D view types. A typical example of the Simple diagram 3D is shown in the following image.
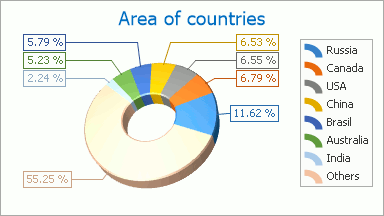
The Pie and Doughnut series are useful when it is necessary to compare the percentage values of different point arguments in the same series. So, the points of a series are distributed along the drawn circle’s radius, which is considered to be 100%. Each slice of this circle represents a portion of the whole series that each point’s value represents.
The Pie and Doughnut series view types are almost identical, the only exception being that the Doughnut series has a hole in its center.
For the 3D diagram types a completely different graphical engine is used, to meet their specific requirements. For this reason, a part of the available functionality is unique (as compared to their 2D analogs), and is supported for these diagram types only. Likewise, it’s impossible to plot 2D and 3D series within the same diagram.
For detailed descriptions of the options available for this diagram type, refer to the following section of this document: Specific Options.
The next section of this document explains how an object of the Simple diagram 3D type can be accessed.
Accessing a Diagram
To access the options of a Simple diagram 3D at design time, click your chart, to select it. Then, in the Properties window, expand the ChartControl.Diagram property.

At runtime, cast your instance of the Diagram object to the SimpleDiagram3D type.
// Cast Diagram to the SimpleDiagram3D type.
SimpleDiagram3D diagram = chart.Diagram as SimpleDiagram3D;
if (diagram != null) {
    // Access to the diagram's options.
    diagram.RuntimeRotation = true;
}
Specific Options
The SimpleDiagram3D.Dimension and SimpleDiagram3D.LayoutDirection properties provide the same functionality as their analogs of the Simple diagram 2D type. These are the only properties which these diagram types have in common. The following is the list of the properties unique for the 3D diagram types. For more detailed information about them, refer to these properties’ descriptions.
Zooming and Scrolling
The Diagram3D.HorizontalScrollPercent and Diagram3D.VerticalScrollPercent properties determine the distance by which a diagram is moved from its central position (specified by the Diagram3D.DefaultScrollPercent constant) as a percentage of the diagram’s width. The scrolling direction is defined by a positive or negative value. Too large a value for these properties will cause the series to expand out of the diagram’s size. In this case, it may be required to allow your end users to scroll the diagram manually, to observe the series in its entirety. To do this, enable the Diagram3D.RuntimeScrolling property.
The Diagram3D.ZoomPercent property determines the magnification level (in percents) applied to the chart. Its value should fall in the 1;500 range. So, the allowed maximum is a fivefold magnification of the diagram. To allow your end users to zoom in and out of the diagram, enable the Diagram3D.RuntimeZooming property.
To learn more, refer to Zooming and Scrolling (3D Charts).
Perspective
In a perspective projection, the lines that are parallel to the object converge as they move towards a theoretical horizon line on the projection surface. The rate at which parallel lines converge is called the perspective angle. This angle is determined by the distance of an imaginary viewer from a 3D diagram object. To enable or disable the 3D perspective, use the Diagram3D.PerspectiveEnabled property. When it is set to true, you can use the Diagram3D.PerspectiveAngle property to define the required angle. Setting the Diagram3D.PerspectiveAngle property to 0 will disable the perspective.
Rotation
To allow your end users to rotate a diagram, enable the Diagram3D.RuntimeRotation property.
There are several rotation types available; you can set the required one via the Diagram3D.RotationType property.
With the RotationType.UseMouseStandard and RotationType.UseMouseAdvanced settings for this property, a 3D chart can be rotated with the Ctrl+mouse pointer (at design time) or using the mouse pointer only (at runtime). The difference between these settings is the algorithm by which rotation is performed.
With the RotationType.UseAngles setting, the 3D chart is rotated around the X, Y and Z axes by the Diagram3D.RotationAngleX, Diagram3D.RotationAngleY and Diagram3D.RotationAngleZ values in the order defined by the Diagram3D.RotationOrder property.
To learn more, refer to Rotation (3D Charts).