XY-Diagram 3D
- 5 minutes to read
This document details specifics of the XY-Diagram 3D type. It lists series view types associated with this diagram type, demonstrates how to access its specific options (both at design time and runtime), and describes these options. Before reading this text, you may wish to review the basics of using the diagram in XtraCharts.
This document consists of the following sections.
Associated Series View Types
In addition to a wide range of 2D series types, the Chart Control has the capability to plot the most part of these series in an attractive and high-resolution pseudo-3D style. Also, Chart Control enables you to adjust the 3D position of your chart using the mouse pointer both at design time and runtime. A typical XY-Diagram 3D example is shown in the following image.
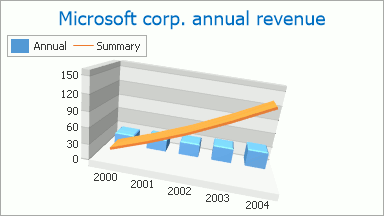
With the XY-Diagram 3D type, you can use series of the following view types.
- Area 3D;
- Full-Stacked Area 3D;
- Full-Stacked Bar 3D;
- Full-Stacked Spline Area 3D;
- Line 3D;
- Manhattan Bar 3D;
- Side-by-Side Bar 3D;
- Side-by-Side Full-Stacked Bar;
- Side-by-Side Stacked Bar;
- Spline 3D;
- Spline Area 3D;
- Stacked Area 3D;
- Stacked Bar 3D;
- Stacked Spline Area 3D;
- Step Line 3D.
A completely different graphical engine is used for 3D diagram types to meet their specific requirements. For this reason, a part of the available functionality is unique (as compared to their 2D equivalents) and is supported for these diagram types only. It’s impossible to plot 2D and 3D series within the same diagram.
For extended descriptions of the options available for this diagram type, refer to the following section of this document: Specific Options.
The next section of this document explains how to access an object of the XY-Diagram 3D type.
Accessing a Diagram
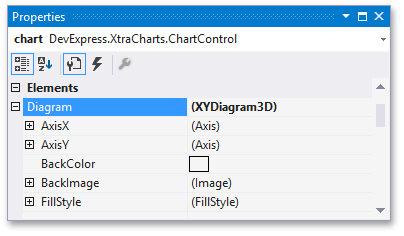
To access XY-Diagram 3D options at design time, click your chart to select it. Then, in the Properties window, expand the ChartControl.Diagram property.
Cast your instance of the Diagram object to the XYDiagram3D type at runtime.
// Cast Diagram to the XYDiagram3D type.
XYDiagram3D diagram = chart.Diagram as XYDiagram3D;
if (diagram != null) {
    // Access the diagram's options.
    diagram.RuntimeRotation = true;
}
Specific Options
The XYDiagram3D.AxisX and XYDiagram3D.AxisY properties produce a similar functionality like their equivalents of the XY-Diagram 2D type. For more information, refer to Axes.
The XYDiagram3D.BackColor, XYDiagram3D.BackImage and XYDiagram3D.FillStyle properties determine a diagram’s background. Note that multiple panes are supported only for the XY-Diagram 2D type. So, to define the 3D diagram background, accessing its panes is not required.
The XYDiagram3D.PlaneDepthFixed property determines the depth (thickness) of coordinate planes, in diagram pixels.
Note
The diagram pixels is a measurement unit introduced specifically for 3D diagrams to meet their unique requirements.
The XYDiagram3D.SeriesDistance and XYDiagram3D.SeriesDistanceFixed properties specify the distance between two series that the 3D diagram plots. The SeriesDistanceFixed property specifies the distance in pixels while SeriesDistance specifies it in X-axis measurement units.
In addition, you can define the distance between ultimate series and the argument coordinate planes (front and back) in diagram pixels, by using the XYDiagram3D.SeriesIndentFixed property.
Also, note that the Tooltip and Crosshair Cursor, Tooltip and ChartControl.CalcHitInfo features are not available for the XY-Diagram 3D.
Here is a list of the properties common for all 3D diagram types. For more detailed information, refer to these descriptions.
Zooming and Scrolling
The Diagram3D.HorizontalScrollPercent and Diagram3D.VerticalScrollPercent properties determine the distance by which a diagram is moved from its central position (specified by the Diagram3D.DefaultScrollPercent constant) as a percentage of the diagram’s width. The scrolling direction is defined by a positive or negative value. Too large a value for these properties will cause the series to expand out of the diagram’s size. In this case, it may be required to allow your end users to scroll the diagram manually, to observe the series in its entirety. To do this, enable the Diagram3D.RuntimeScrolling property.
The Diagram3D.ZoomPercent property determines the magnification level (in percents) applied to the chart. Its value should fall in the 1;500 range. So, the allowed maximum is a fivefold magnification of the diagram. To allow your end users to zoom in and out of the diagram, enable the Diagram3D.RuntimeZooming property.
To learn more, refer to Zooming and Scrolling (3D Charts).
Perspective
In a perspective projection, the lines that are parallel to the object converge as they move towards a theoretical horizon line on the projection surface. The rate at which parallel lines converge is called the perspective angle. This angle is determined by the distance of an imaginary viewer from a 3D diagram object. To enable or disable the 3D perspective, use the Diagram3D.PerspectiveEnabled property. When it is set to true, you can use the Diagram3D.PerspectiveAngle property to define the required angle. Setting the Diagram3D.PerspectiveAngle property to 0 will disable the perspective.
Rotation
To allow your end users to rotate a diagram, enable the Diagram3D.RuntimeRotation property.
There are several rotation types available; you can set the required one via the Diagram3D.RotationType property.
With the RotationType.UseMouseStandard and RotationType.UseMouseAdvanced settings for this property, a 3D chart can be rotated with the Ctrl+mouse pointer (at design time) or using the mouse pointer only (at runtime). The difference between these settings is the algorithm by which rotation is performed.
With the RotationType.UseAngles setting, the 3D chart is rotated around the X, Y and Z axes by the Diagram3D.RotationAngleX, Diagram3D.RotationAngleY and Diagram3D.RotationAngleZ values in the order defined by the Diagram3D.RotationOrder property.
To learn more, refer to Rotation (3D Charts).