Simple Diagram
- 4 minutes to read
This document details the specifics of the Simple diagram type. It lists the series view types associated with this diagram type, demonstrates how its specific options can be accessed (both at design and runtime), and briefly describes these options. Before reading this text, you may wish to review the basics of using diagram in the WinForms Chart Control.
This document consists of the following sections.
Associated Series View Types
The Simple diagram is intended to plot series of the following view types
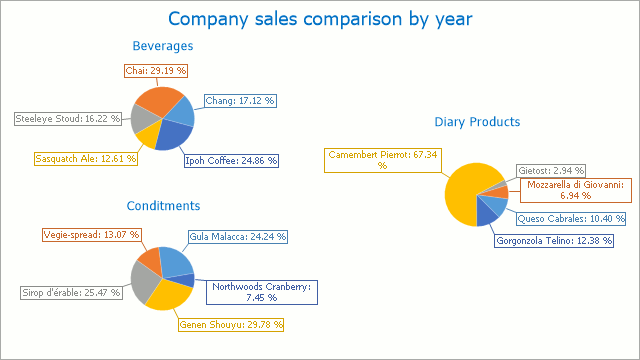
A typical example of a Simple diagram is shown in the following image.
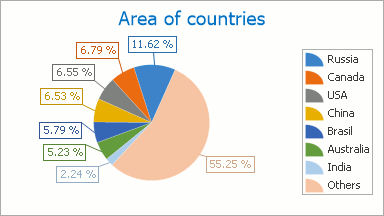
The Pie and Doughnut series are useful when it is necessary to compare the percentage values of different point arguments in the same series. So, the points of a series are distributed along the drawn circle’s radius, which is considered to be 100%. Each slice of this circle represents a portion of the whole series that each point’s value represents.
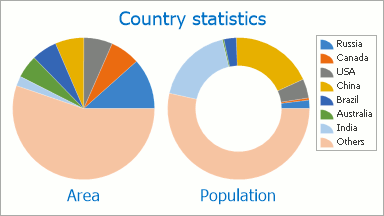
The Pie and Doughnut series view types are almost identical, the only exception being that the Doughnut series has a hole in its center.
The following image demonstrates series of both types plotted in the same diagram: the Pie series on the left, and the Doughnut on the right.
For example, a funnel chart can represent a sales funnel that indicates sale process stages, including potential loses at each stage. This helps to identify weak points in an organization’s current sales processes, and indicate possible bottlenecks within the data.
The funnel displays a process that starts at 100%, with subsequent stages having a progressively lower percentage. The data point with the greatest value in the collection is 100% (the top of the funnel), which represents the widest polygon. The next series point value is represented by a smaller polygon, whose top width represents the value’s ratio to the previous point value. This continues up until the last point, which has a bottom width equal to its top width.
The following image demonstrates a typical Funnel chart.

Accessing a Diagram
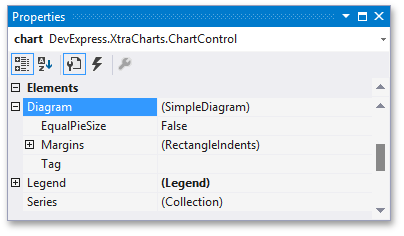
To access the diagram’s options at design time, click your chart, to select it. Then, in the Properties window, expand the ChartControl.Diagram property.
At runtime, cast your instance of the Diagram object to the Simple Diagram type.
// Cast Diagram to the SimpleDiagram type.
SimpleDiagram diagram = chart.Diagram as SimpleDiagram;
if (diagram != null) {
    // Access the diagram's options.
    diagram.Dimension = 2;
    diagram.LayoutDirection = LayoutDirection.Vertical;
}
Specific Options
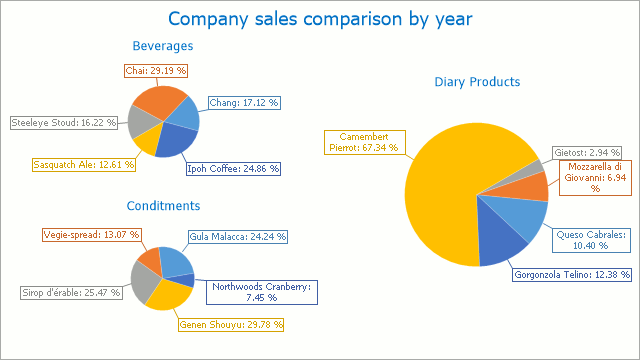
You can see the following options, specific for the Simple diagram type: SimpleDiagram.Dimension and SimpleDiagram.LayoutDirection properties. Both these properties determine the layout of multiple Pie, Doughnut or Funnel series within a single diagram. They are briefly described below. For more detailed information about them, refer to these properties’ descriptions.
- The SimpleDiagram.Dimension property determines the number of series that can be displayed on one line (row or column);
- The SimpleDiagram.LayoutDirection property determines the direction in which multiple series are positioned within a diagram (LayoutDirection.Horizontal or LayoutDirection.Vertical).
- The SimpleDiagram.Margins property allows you to keep the required indents of the diagram’s edges.
In addition, you can provide the equal size for all pies (doughnuts) series on a diagram by their minimal size using the SimpleDiagram.EqualPieSize property.
The following images demonstrate the comparison of appearances of diagrams with and without using this feature.
SimpleDiagram.EqualPieSize = false
SimpleDiagram.EqualPieSize = true
Note
When the SimpleDiagram.EqualPieSize property is set to true, the PieSeriesView.MinAllowedSizePercentage property will affect those series that have a lesser allowed size.