How to: Change the Display Format for Axis Labels
- 2 minutes to read
The following tutorial demonstrates how to customize the display format of the date-time values for the X-axis labels at design time. To learn more about using different scale types in XtraCharts, refer to the Axis Scale Types.
In this example, we use a simple unbound chart with a set of manually entered points for its series. These points’ values are shown in the following image.
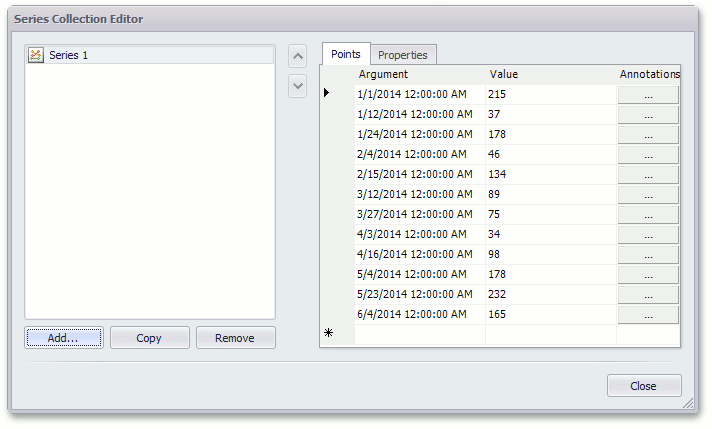
Note
The approach described below can also be applied to a data-bound chart.
To change the display format of the date-time values for the X-axis labels, do the following.
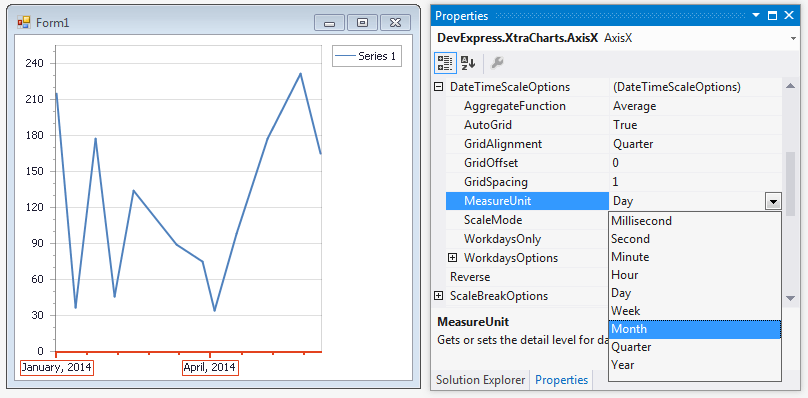
Select the axis of arguments (X-axis), and in the Properties window, set the DateTimeScaleOptions.MeasureUnit property to Month.
As you can see, the appearance of X-axis labels have not changed.
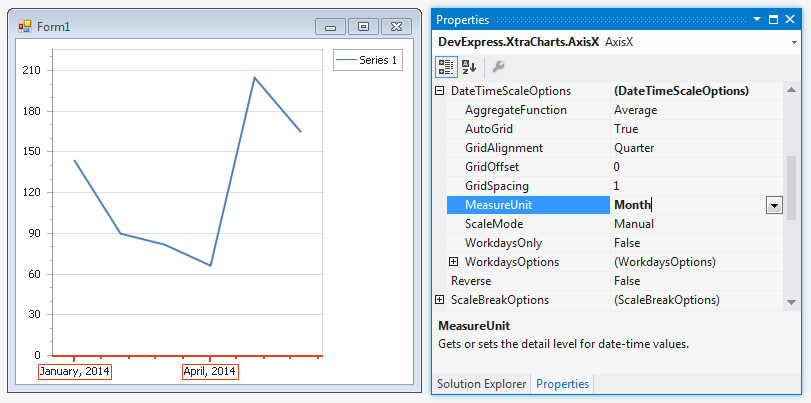
This happens because grid lines spacing is calculated automatically by default (the ScaleGridOptionsBase.AutoGrid is set to true), and the grid calculation algorithm does not change the DateTimeScaleOptions.GridAlignment property value (the Quarter measure unit value) for our data.
To change X-axis label appearance, set the DateTimeScaleOptions.GridAlignment property to Month.
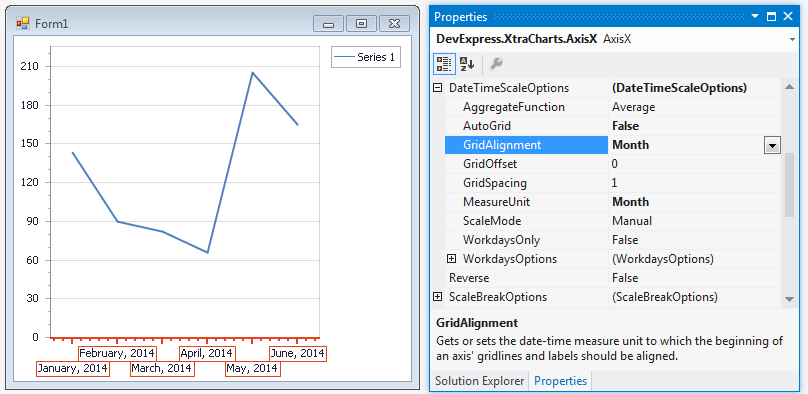
This resets the grid automatic calculation (the ScaleGridOptionsBase.AutoGrid is set to false).
The next steps illustrate how to format axis labels using their built-in Argument placeholder together with the format specifier.
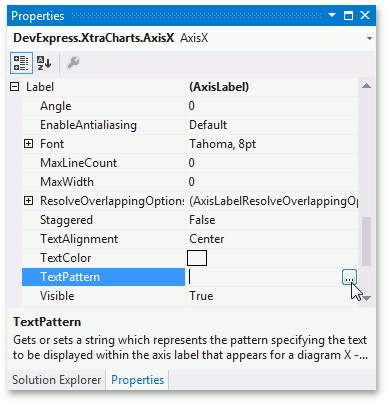
To specify a pattern for axis labels, expand Label in the Properties window and locate the AxisLabel.TextPattern property. Then, click the ellipsis button.
In the invoked Pattern Editor, double click Argument in the ‘Placeholders:’ column. Then, select the dd-MMM-yy format in the ‘Format:’ column to display day, month and year in the axis labels. You can see the final pattern in the ‘Pattern:’ column.
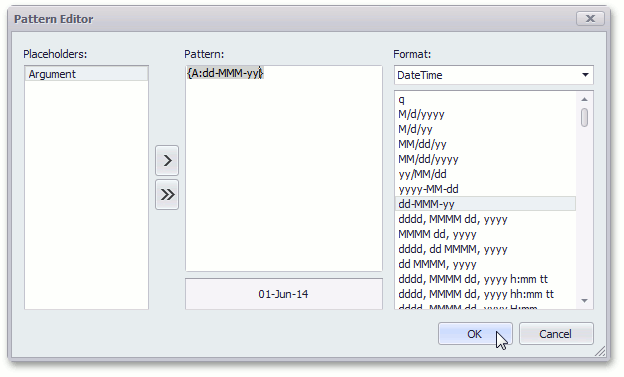
- To apply the pattern, click OK. This closes the Pattern Editor.
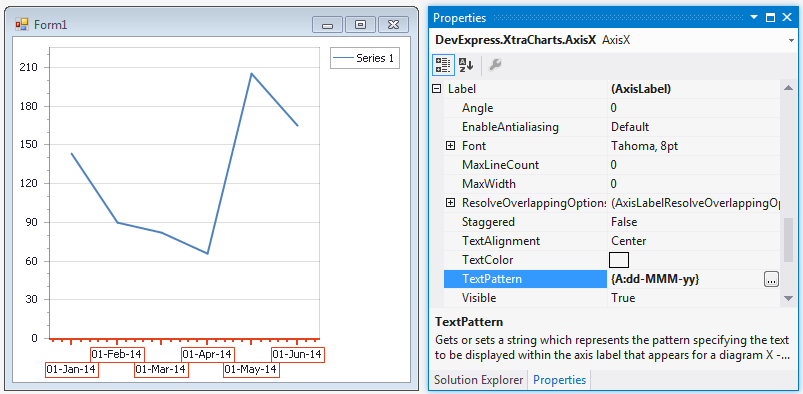
The result is shown in the following image.
You can also specify this text pattern for axis labels via the Chart Designer.