Chart Element Hierarchy
- 2 minutes to read
This document briefly describes basic Chart Control hierarchy, lists the general elements of a chart, and provides links to more detailed related topics.
The available chart elements differ for different diagram types. And the diagram type in its turn is dependent on a series views types of the first added series to a chart. The structures of the main diagram types are represented below.
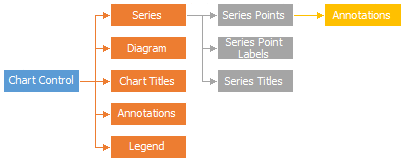
Simple (Pie, Donut and Funnel) Diagram
The following diagram illustrates the structure of a chart control displaying the series views compatible with the Simple Diagram.
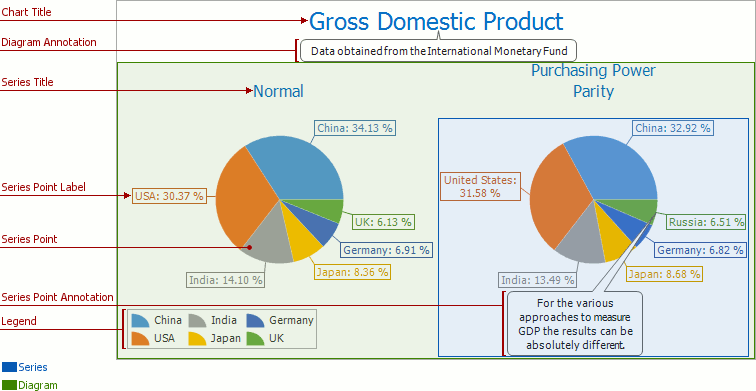
The next image demonstrates the chart control with its marked elements.
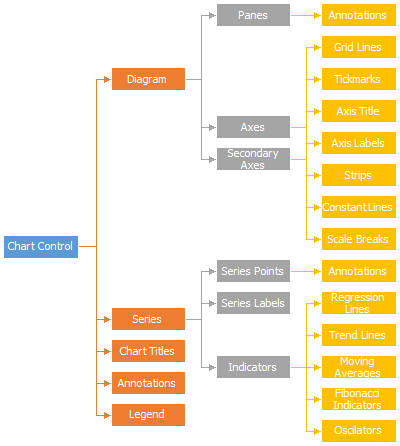
XY (Cartesian) Diagram
The following diagram shows the structure of the chart control displaying the XY-Diagram.
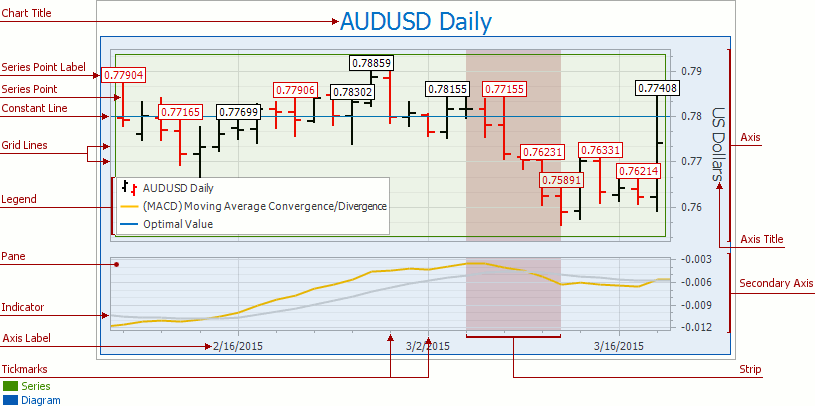
The image below contains the chart control with labeled chart items.
Radar and Polar Diagrams
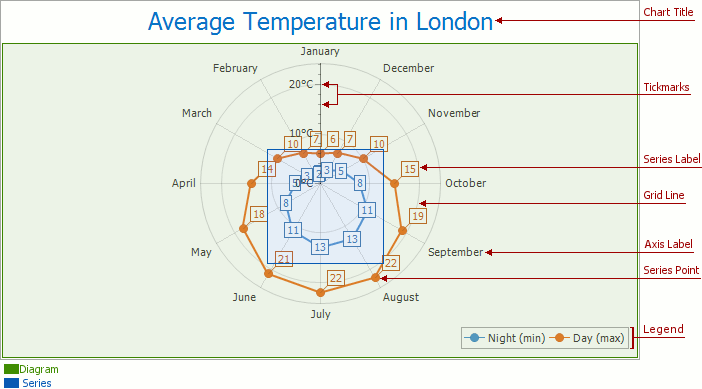
The structure of the chart displaying the Radar or Polar diagram is represented below.
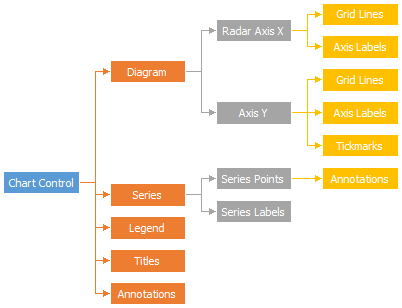
The next image represents the chart control displaying the radar diagram with marked chart elements.
The elements shown in diagrams above are listed below. Refer to the these topics to learn more about each element.
Note
The Chart Control can hide its elements if there is insufficient space to display them. Elements are hidden in the following order:
To make the Chart Control always display its elements, disable the ChartControl.AutoLayout property.