Axis Labels
- 7 minutes to read
The Chart Control can display default and custom axis labels.
Tip
Troubleshooting - Axis Labels FAQ (Support Center).
Note
The Chart Control can hide its elements if there is insufficient space to display them. Elements are hidden in the following order:
To make the Chart Control always display its elements, disable the ChartControl.AutoLayout property.
Default Axis Labels
The default axis labels display values for major tickmarks of diagram axes. The Chart Control generates them based on series data.
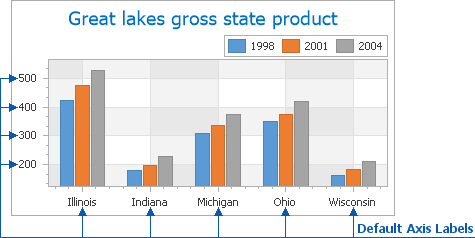
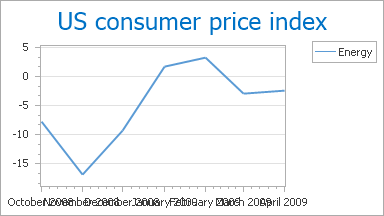
The Chart Control automatically calculates the grid layout so that certain axis labels are hidden depending on the actual chart size to avoid overlapping labels.
The following image illustrates the chart layout with hidden X-Axis labels (category names):

To display all axis labels, disable the scale’s AutoGrid option and set the GridSpacing property to 1.

You can organize qualitative axis labels in a custom order. Refer to the following help topic for more information: QualitativeScaleComparer.
Custom Axis Labels
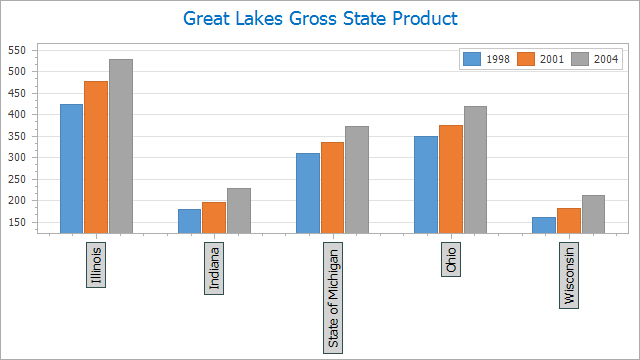
You can create custom axis labels and modify their position and content. The following image shows an X-axis’s custom label:
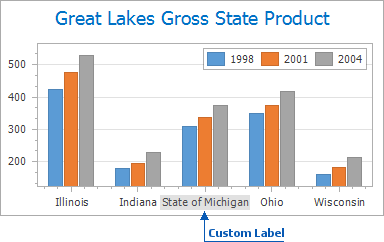
The Axis2D.CustomLabels property contains the custom axis label collection. If the collection does not contain any visible custom labels, the default axis labels are shown. Set the Axis2D.LabelVisibilityMode property to AutoGeneratedAndCustom to display custom and default labels simultaneously.
To add custom labels at design time, follow the steps below:
Select an axis in the diagram, and locate the Axis2D.CustomLabels property in the Properties window. Click its ellipsis button to invoke the Custom Axis Label Collection Editor.
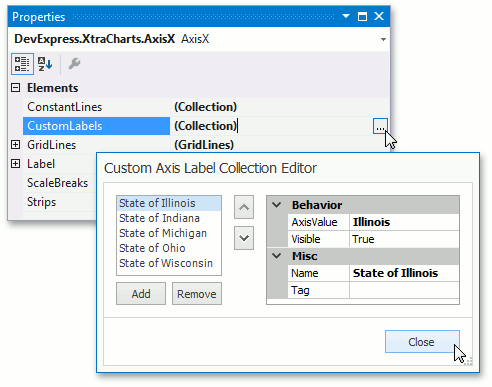
Click Add to create a label and set its CustomAxisLabel.AxisValue and ChartElementNamed.Name properties. The AxisValue should be in the range specified in the AxisBase.WholeRange property to display the custom label in the diagram.
The following example adds a custom label at runtime:
private void Form1_Load(object sender, EventArgs e) {
    XYDiagram diagram = (XYDiagram)chartControl.Diagram;
    AxisX axisX = diagram.AxisX;
    // Add a custom label to the X-axis.
    axisX.CustomLabels.Add(new CustomAxisLabel(name: "State of Michigan", value: "Michigan") {
        TextColor = Color.FromArgb(255, 74, 74, 74),
        BackColor = Color.FromArgb(255, 225, 225, 225)
    });
    // Make defaul and custom labels visible.
    axisX.LabelVisibilityMode = AxisLabelVisibilityMode.AutoGeneratedAndCustom;
}
Note
Radar and Polar diagrams do not support custom axis labels. You can handle the ChartControl.CustomDrawAxisLabel event to change the axis label text at runtime.
Format Default Label Text
You can use the AxisLabel.TextPattern property to format the text of default axis labels. The TextPattern property can contain predefined placeholders, format specifiers, and plain text.
The following table lists available placeholders:
| Pattern | Description |
|---|---|
| {A} | Displays series point arguments (only for argument axes). |
| {V} | Displays series point values (only for value axes). |
| {VP} | Displays series point values as a percentage (only for value axes). |
TextPattern can be applied to date-time or numeric scale values. For example, for the qualitative scale type, the TextPattern property has no effect. Use the AxisLabel.Formatter property instead.
At runtime
The example below specifies text patterns for X-axis and Y-axis labels:
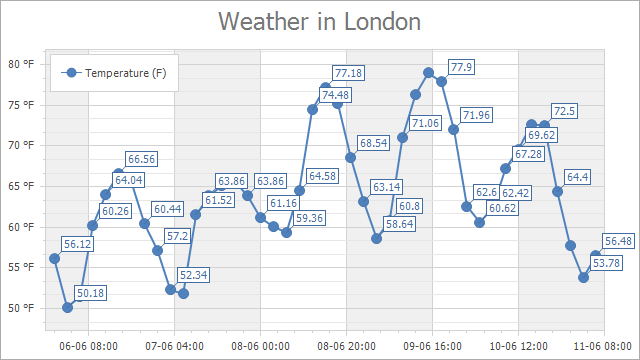
AxisLabel axisXLabel = ((XYDiagram)chartControl.Diagram).AxisX.Label;
AxisLabel axisYLabel = ((XYDiagram)chartControl.Diagram).AxisY.Label;

axisXLabel.TextPattern = "{A:dd-MM HH:mm}";
axisYLabel.TextPattern = "{V} °F";
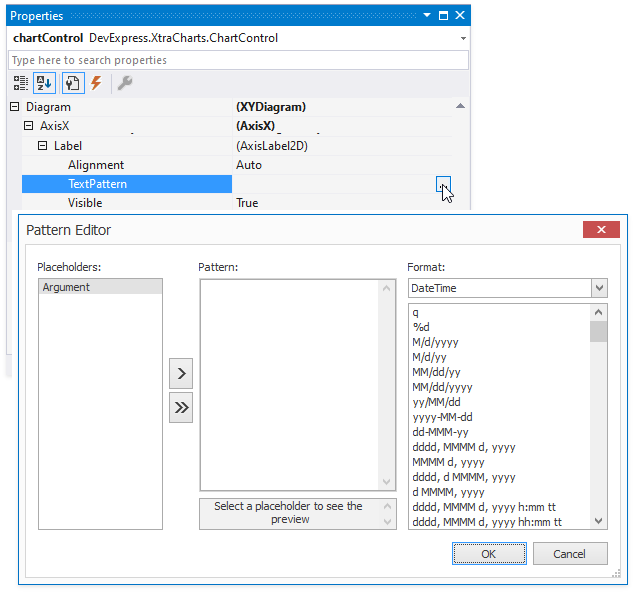
At Design Time
Use the Pattern Editor to specify a text pattern at design time. Click the ellipsis button of the Label.TextPattern property in the Properties window to invoke the editor.
You can also specify the AxisLabel.Formatter property to generate text strings for axis labels based on a custom condition or change an order of magnitude of axis label values. If the Formatter property is specified, the AxisLabel.TextPattern value is ignored.
This example applies a custom format to numeric axis labels:
private void OnFormLoad(object sender, EventArgs e) {
    XYDiagram diagram = (XYDiagram)chartControl1.Diagram;
    AxisLabelFormatter formatter = new AxisLabelFormatter();
    diagram.AxisX.Label.Formatter = formatter;
    diagram.AxisY.Label.Formatter = formatter;
}
public class AxisLabelFormatter : IAxisLabelFormatter {
    public string GetAxisLabelText(object axisValue) {
        return Convert.ToString((double)axisValue / 1000);
    }
}
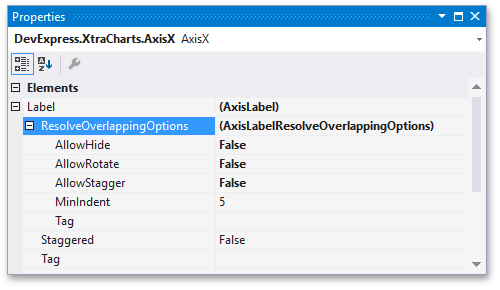
Resolve Axis Label Overlap
The Chart Control includes the Resolve Overlap algorithm that rotates, staggers, and hides axis labels when they cannot display the entire text due to lack of space. You can use the Resolve Overlap options to configure this algorithm. The image below shows a chart with these options disabled:
The following animation shows how the Resolve Overlap algorithm works:
Use the AxisLabel.ResolveOverlappingOptions property to access the AxisLabelResolveOverlappingOptions object and configure it at design time.
The example below specifies the ResolveOverlappingOptions at runtime:
AxisLabel axisLabel = ((XYDiagram)chartControl.Diagram).AxisX.Label;

axisLabel.ResolveOverlappingOptions.AllowHide = false;
axisLabel.ResolveOverlappingOptions.AllowRotate = false;
axisLabel.ResolveOverlappingOptions.AllowStagger = false;
axisLabel.ResolveOverlappingOptions.MinIndent = 5;
Related API Members:
| Member | Description |
|---|---|
| AxisLabelResolveOverlappingOptions.AllowHide | Indicates whether the Chart Control can hide axis labels when resolves the label’s overlap. |
| AxisLabelResolveOverlappingOptions.AllowRotate | Indicates whether the Chart Control can rotate axis labels when resolves the label’s overlap. |
| AxisLabelResolveOverlappingOptions.AllowStagger | Indicates whether the Chart Control can stagger axis labels when resolves the label’s overlap. |
| AxisLabelResolveOverlappingOptions.MinIndent | Specifies the minimum indent between axis labels when the Resolve Overlap algorithm is applied to them. |
The AllowRotate and AllowStagger properties only affect labels of a horizontal XY-Diagram axis (the argument X-axis or the value Y-axis when XYDiagram.Rotated is set to true).
Customize Label Appearance
Axis Label Properties
You can change the text color, background color, border settings, font, and orientation of axis labels. The Chart Control applies appearance settings to both default and custom axis labels. The following appearance customization properties are available:
Use the Axis2D.Label property to access these settings.
The example below changes appearance settings of default and custom axis labels:
private void Form1_Load(object sender, EventArgs e) {
    XYDiagram diagram = (XYDiagram)chartControl.Diagram;
    AxisX axisX = diagram.AxisX;
    // Add a custom label to the X-axis.
    axisX.CustomLabels.Add(new CustomAxisLabel(name: "State of Michigan", value: "Michigan") {
    });
    // Make default and custom labels visible.
    axisX.LabelVisibilityMode = AxisLabelVisibilityMode.AutoGeneratedAndCustom;

    axisX.Label.Angle = -90;

    axisX.Label.EnableAntialiasing = DevExpress.Utils.DefaultBoolean.True;
    axisX.Label.DXFont = new DevExpress.Drawing.DXFont("Tahoma", 10, DevExpress.Drawing.DXFontStyle.Regular);
    axisX.Label.TextColor = System.Drawing.Color.Black;

    axisX.Label.Border.Visibility = DevExpress.Utils.DefaultBoolean.True;
    axisX.Label.Border.Color = System.Drawing.Color.DarkSlateGray;
    axisX.Label.Border.Thickness = 1;

    axisX.Label.FillStyle.FillMode = FillMode.Solid;
    axisX.Label.BackColor = System.Drawing.Color.LightGray;
}
The CustomDrawAxisLabel Event
You can handle the ChartControl.CustomDrawAxisLabel event to customize an individual (default or custom) axis label. See the following example for more information: How to: Individually Customize Axis Labels.