Axis Titles
- 2 minutes to read
This document describes how axis titles can be displayed and customized, and gives a short description of their properties.
This document consists of the following sections.
Axis Titles Overview
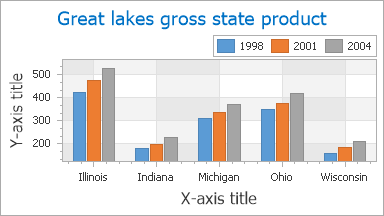
For both a diagram’s primary and secondary axes, it’s possible to display and customize their text titles, which are shown in the following image.
Note that for each axis it’s only possible to display a single AxisTitle object at a time. And, a chart’s accompanying information can be displayed using chart titles, an unlimited number of which are supported.
Note
The Chart Control can hide its elements if there is insufficient space to display them. Elements are hidden in the following order:
- Legends
- Axis Titles
- Series Titles
- Pane Titles
- Axes
- Chart Title
- Breadcrumbs
To make the Chart Control always display its elements, disable the ChartControl.AutoLayout property.
To display an axis title at design time, click on the required axis within the chart diagram, to select it. Then, in the Properties window, expand the Axis2D.Title property, and set the TitleBase.Visible property to true.
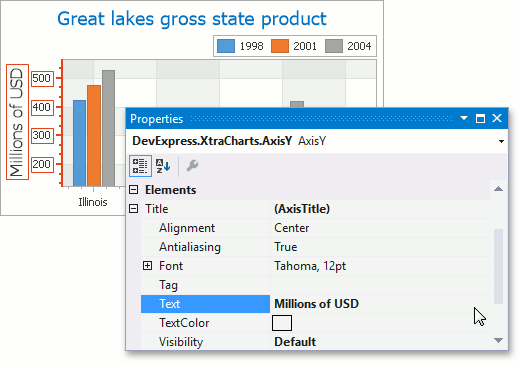
An axis title’s customization options are briefly described below.
- The AxisTitle.Alignment property determines the alignment of the title along the axis.
- The TitleBase.EnableAntialiasing property allows you to apply antialiasing to the title’s font. In some cases, this may help to improve the readability of the font.
- The TitleBase.Font property controls the options which specify the font used to display the title’s text.
- The Title.Text property allows you to enter the required text for the title.
- The TitleBase.TextColor property determines the title’s color.
Axis Titles Hit-Testing
As with the majority of other chart elements, hit testing is supported for axis titles, as well. This means that you can display any additional information related to the corresponding axis (e.g. its name or type) for your end-users after they click or hover its title.
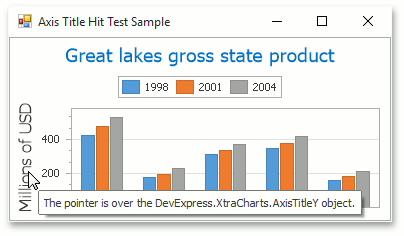
You can obtain an axis title in the ChartControl.ObjectHotTracked event. For more information, refer to How to: Determine whether an Axis Title is Being Hovered by the Mouse Pointer.