Primary and Secondary Axes
- 4 minutes to read
This document describes the difference between primary and secondary axes and how secondary axes can be created and assigned to a series. Before you proceed with this document, you may wish to review the basics of using axes.
This document consists of the following sections.
Understand Primary and Secondary Axes
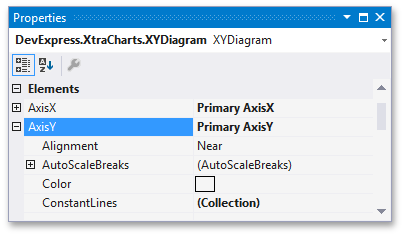
By default, a chart’s diagram contains two primary axes - the axis of arguments (X-axis) and the axis of values (Y-axis). To access them at design time, in the Properties window, expand the ChartControl.Diagram property.
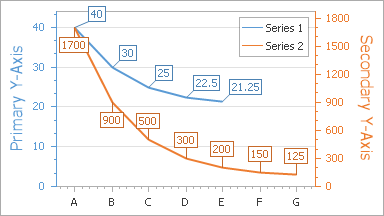
For each chart, it’s possible to plot only a single primary axis of each type (a single X-axis and a single Y-axis). However, in some scenarios these axes are not enough, and it’s required to use secondary axes. They are supported only for the most common diagram type - XY-Diagram 2D. This may be needed if, for example, it’s required to display series of a significantly different range of values, or having entirely different arguments (or values) within a single diagram.
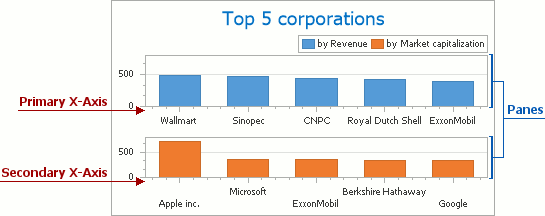
Another common scenario when secondary axes are useful, is when series are distributed among multiple panes. Most often, in this case, it’s required to plot a primary axis through all panes, and create a secondary axis for each additional pane. For more information on this, refer to Panes.
The most important difference between primary and secondary axes is that there cannot be multiple primary axes, while with secondary axes, it is possible to create an unlimited number of them.
Another notable difference between primary and secondary axes concerns axis alignment. In particular, for the Axis2D.Alignment property, the AxisAlignment.Zero setting is available for the primary axes only. To learn more on this, refer to Axis Appearance and Position.
In other aspects, primary and secondary axes are similar. That is, their appearance and layout can be customized in the same ways, they can possess similar additional elements (such as grid lines, constant lines and titles, and so on. For general information about customizing axes, refer to Axes.
To learn how secondary axes can be created and associated with series, refer to the next section of this document.
Add Secondary Axes
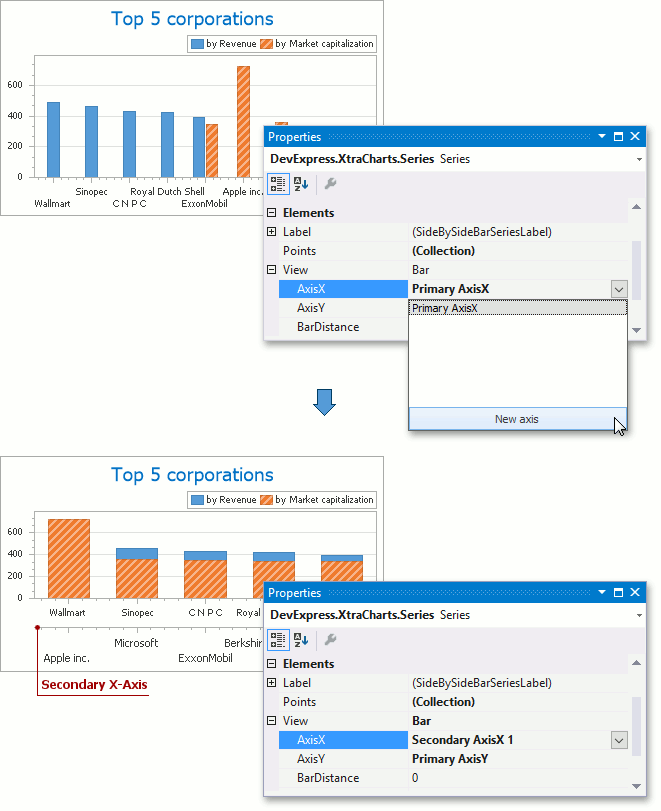
The simplest way to create a secondary axis and assign it to a series, is to select the series, and in the Properties window, expand the XYDiagramSeriesViewBase.AxisX (or, XYDiagramSeriesViewBase.AxisY) property. In the invoked editor, click New axis, to add a new secondary axis to the diagram’s collection, and assign it to this series.
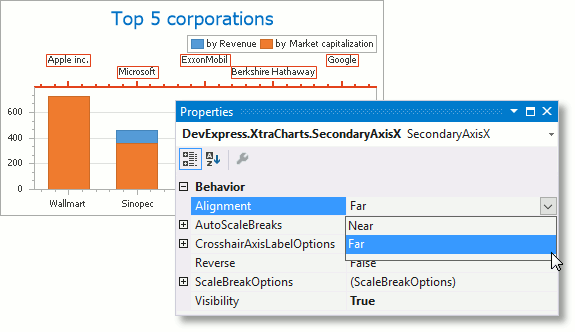
Then, it’s possible to customize the created secondary axis, e.g. replace it by setting its Axis2D.Alignment property to AxisAlignment.Far (as opposed to AxisAlignment.Near, to which it is set by default).
If your chart’s diagram contains multiple panes, a secondary axis is automatically displayed in that pane associated with a series to which the secondary axis belongs. To learn more on this, refer to Panes.

Secondary axes reside in the diagram’s collections, returned by the XYDiagram.SecondaryAxesX and XYDiagram.SecondaryAxesY properties. So, to access these collections, in the Properties window, expand the ChartControl.Diagram property, and for the appropriate property, click the ellipsis button. The Secondary Axis Collection Editor will appear.
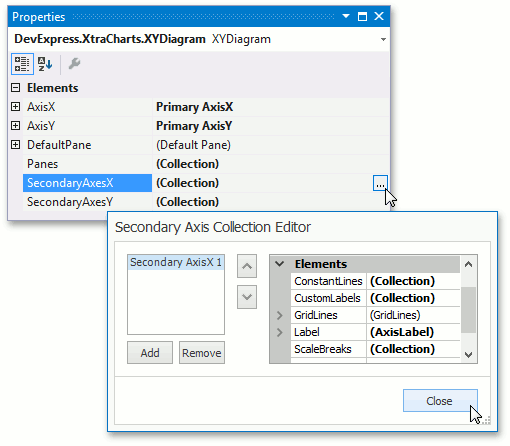
In this dialog, you can add or remove the collection’s items using the appropriate buttons, and customize secondary axes as required. Since the set of available properties for secondary axes is identical to the properties of the primary axes, refer to Axes and Axis Appearance and Position, to learn more about them.
To quit the dialog and apply the changes, click Close.