Series Scale Types
- 2 minutes to read
This document briefly describes the specifics of series scale types in the WinForms Chart Control.
Each series should have an appropriate scale type defined for its point arguments and values. The scale type determines how the chart control interprets the series’ underlying data (as qualitative, numeric, date-time or time-span), and it directly affects the chart’s overall output.
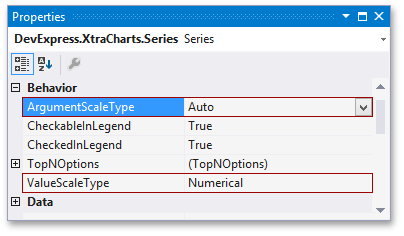
Usually, you do not need to change the argument scale type of the SeriesBase.ArgumentScaleType property (set to Auto mode by default) because the type of series point argument is detected automatically, based on the underlying data type. If you wish to change the Numerical value scale type, use the SeriesBase.ValueScaleType property.
Note
For auto-created series, the series scale properties reside within the ChartControl.SeriesTemplate property.
The following image demonstrates the look of a chart with its series having the DateTime argument scale type (with the format set to display months only), and the Numerical value scale type (in the currency format).
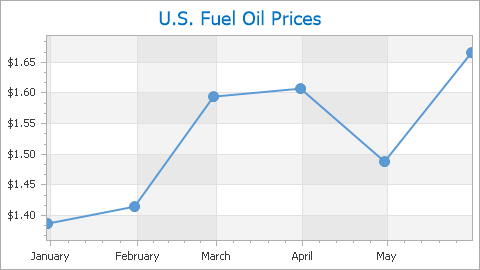
Due to the date-time data specifics, a special document highlights aspects of its use: Data Aggregation.
A series scale type is strongly tied to the scale type of the axes with which the series is associated. So, for more information on using scale types in XtraCharts, refer to Axis Scale Types.