Legends
- 3 minutes to read
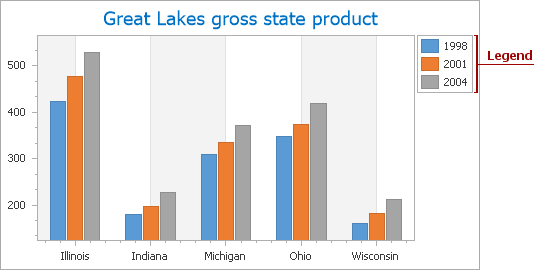
The Legend is an explanatory component that accompanies a chart’s diagram, identifying its most important visual elements: series, series points (in some cases), constant lines, strips, and indicators.
Note that it is possible to create multiple legends on each chart. Refer to the Adding Legends topic to learn how to add several legends to a chart.
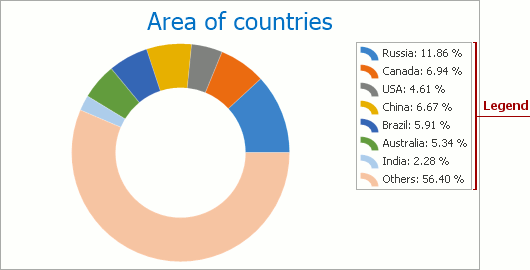
In most cases, a legend displays series names, however, it can also show data points that belong to the same series. To apply this legend representation format to series of most view types, enable their SeriesViewColorEachSupportBase.ColorEach property. Note that this legend view is automatically applied to the Pie series.
A legend that lists and identifies data points belonging to a single series is demonstrated in the following image, using a pie chart as an example:
Each item shown in the legend can be represented by:
a textual description only;

a marker and textual description pair for the legend item (the default option);

a check box and textual description pair for the legend item.

a check box, marker and textual description triplet for the legend item.
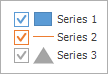
a marker, check box and textual description triplet for the legend item.

The Legend.MarkerMode property controls a marker and check box visibility and order. Refer to the Legend Items document for more information about legend items.
Note
The chart’s visual element can be displayed on a legend if its Visible and ShowInLegend properties are enabled (ConstantLine.Visible, Indicator.Visible, SeriesBase.Visible, Strip.Visible).
If you wish to see multiple series on a legend, they should have compatible view types. Refer to the Series Views Compatibility topic for details.
A legend title can accompany a legend, as the following image demonstrates:
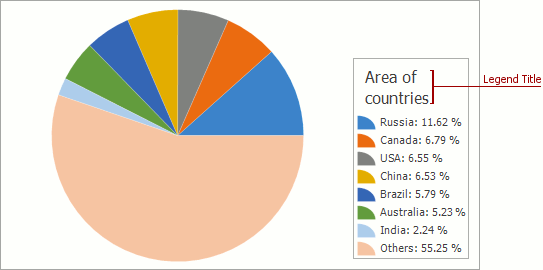
Refer to the Legend Title document For more information about legend titles.
A legend is positioned relative to a chart or a pane. For example, in the following image all legends are inside panes with different alignments:
Refer to the Legends Alignment and Layout topic for more information about legend positioning.
You can modify the legend font, background, border and add a shadow if its appearance does not meet your requirements. Refer to the Legends Appearance topic for more information.
Note
The Chart Control can hide its elements if there is insufficient space to display them. Elements are hidden in the following order:
To make the Chart Control always display its elements, disable the ChartControl.AutoLayout property.