Strips
- 3 minutes to read
This document describes how to display strips across axes, and customize their appearance. Before you proceed with this document, you may wish to review the basics of using axes.
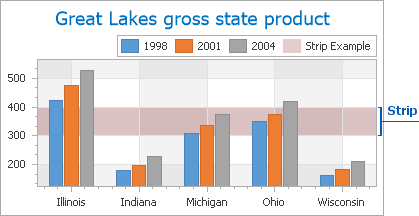
Strips are the highlighted areas in a chart’s diagram within the defined range of values (minimum and maximum) of an axis, to which they belong. In general, strips are used to visually represent a range of values behind series, to trace whether the series points’ values fall in or out of that range.
The following image demonstrates an implementation of a strip.
Strips belong to an axis object, and it’s possible to add multiple strips to an axis’ appropriate collection, which can be accessed via the Axis2D.Strips property.
To create a strip and add it to an axis at design time, locate the axis in the Properties window, and click the ellipsis button for the Axis2D.Strips property. The Strip Collection Editor will appear.
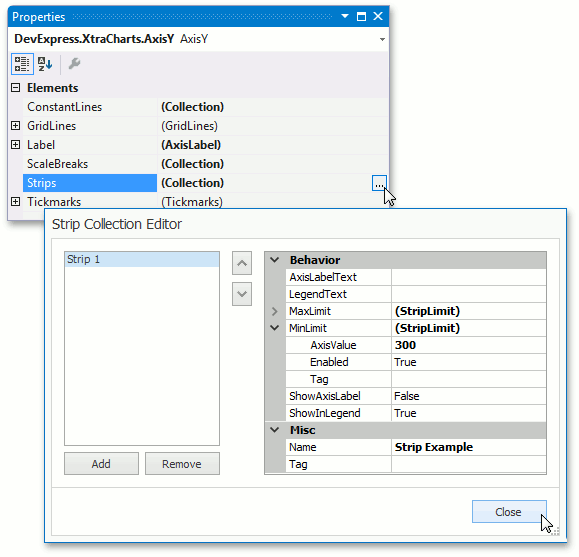
In this editor, click Add, to create a strip. Then, you can define its properties.
The most important properties of a strip are the Strip.MinLimit and Strip.MaxLimit properties, which define the range of values within which the strip should be drawn. To enable these limits, set their StripLimit.Enabled properties to true.
If the StripLimit.Enabled property of either limit is disabled, the strip will occupy the whole range up or down from the opposite limit’s value. If the StripLimit.Enabled properties of both limits are disabled, the strip will occupy the whole range of the axes values.
Then, define the StripLimit.AxisValue properties of the strip’s limits. The values of these properties should be defined in the measure units appropriate for the current axis (to learn more on this, refer to Axis Scale Types).
Note
The minimum limit of the strip should be less than the maximum limit, otherwise the error message is shown.
In addition, it’s possible to show the strip’s description in the chart’s legend, and as a distinct axis label. To do this, enable the Strip.ShowInLegend and Strip.ShowAxisLabel properties accordingly. The text of these descriptions can be defined independently from the strip’s ChartElementNamed.Name, via the Strip.LegendText and Strip.AxisLabelText properties.
The appearance of a strip is determined by the Strip.Color and Strip.FillStyle properties.
To hide a strip, while not completely removing it from the axis’ collection, disable the strip’s Strip.Visible property.