How to: Link a Chart to the PivotGridControl's Data Source
- 2 minutes to read
This tutorial demonstrates how you can link a ChartControl to a Pivot Grid Control at design time, and adjust the options of this bridged pair. For general information, see Pivot Charting (Integration with a Pivot Grid Control).
Tip
A complete sample project is available in the DevExpress Code Examples database at http://www.devexpress.com/example=E4983.
To link a chart to a pivot grid, do the following.
- Start MS Visual Studio (2008 or 2010), and create a new Windows Forms Application, or open an existing one.
- Drop the PivotGridControl item from the DX.18.2: Data toolbox tab onto the form, and bind it to the “GSP” table in the gsp.mdb file that is shipped with the XtraCharts installation.
Then, drop the ChartControl onto the same form, and set its ChartControl.DataSource property to the Pivot Grid instance.
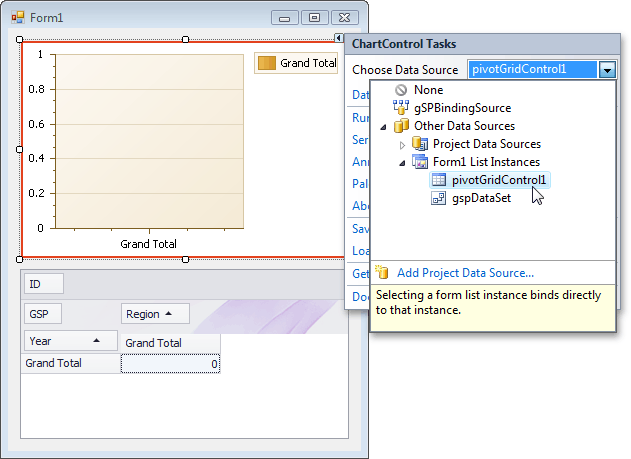
At this time, all the chart’s binding and layout settings are adjusted automatically, and you can launch the application, yielding the following result.
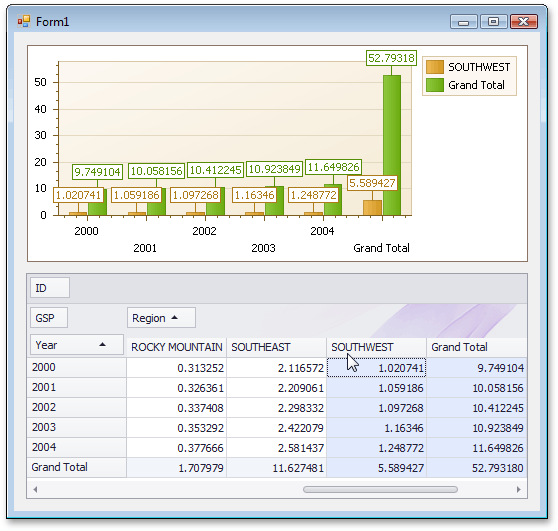
To exclude the column grand totals from the chart, set the corresponding option in the chart’s ChartControl.PivotGridDataSourceOptions.
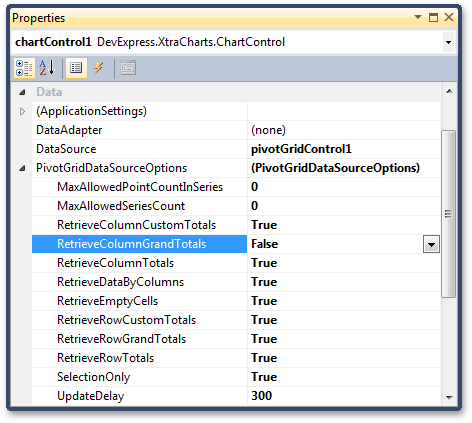
As a result, a user can choose the required rows in the Pivot Grid, to see only the actual cell values.
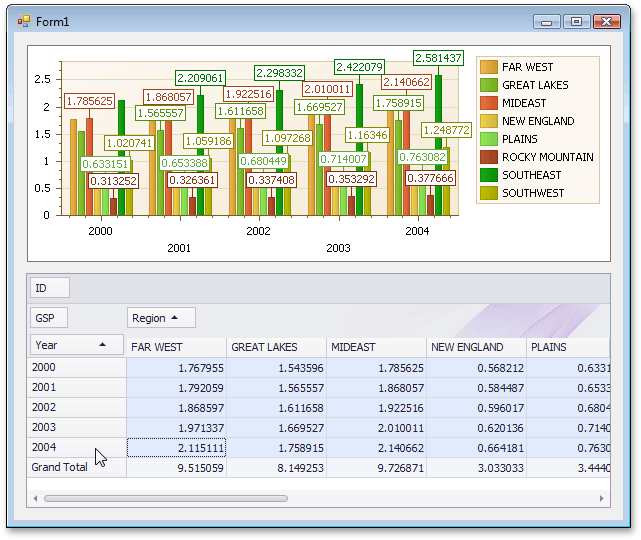
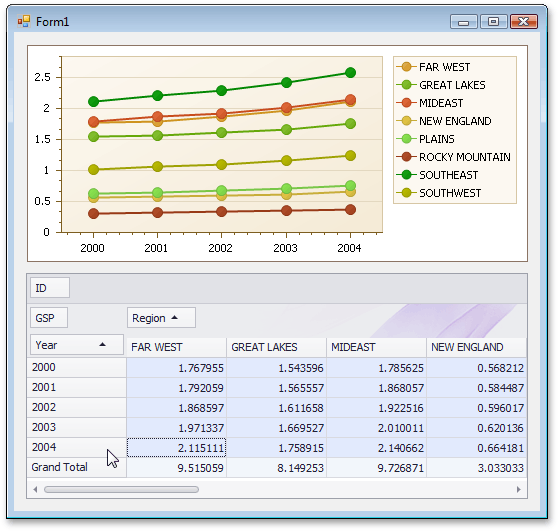
If this result is not satisfactory, adjustments to the automatic options can be made (e.g. disable the AxisLabel.Staggered property of axis labels, and change the series view type to Line).
To so this, handle the corresponding events as the following code demonstrates.
using DevExpress.XtraCharts; // ... private void chartControl1_CustomizeXAxisLabels(object sender, CustomizeXAxisLabelsEventArgs e) { e.Staggered = false; } private void chartControl1_BoundDataChanged(object sender, EventArgs e) { ((ChartControl)sender).SeriesTemplate.ChangeView(ViewType.Line); }The result (with the point labels completely hidden) is shown in the following image.
For the complete list of the automatic settings, as well as the event handlers where they can be adjusted, see Pivot Charting (Integration with a Pivot Grid Control).