Box Plot Chart
- 6 minutes to read
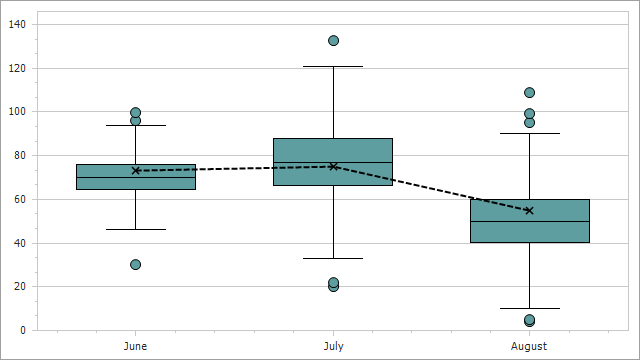
The Box Plot (also called Box-and-Whisker Plot) chart is used to analyze statistic-driven data points. To draw a Box Plot point, you must pass the Min, Quartile1, Median, Quartile3 and Max parameters. You can optionally display a set of Outliers and a Mean value.
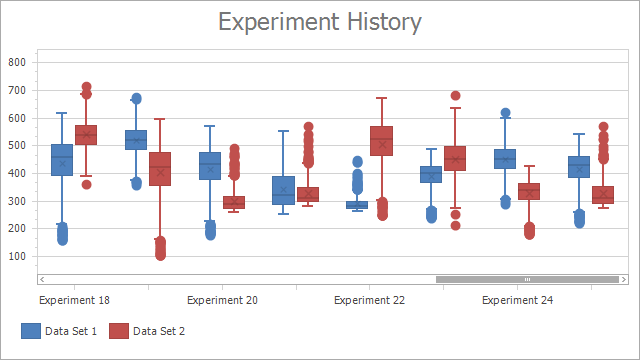
Chart Type Characteristics
The table below lists the main box plot chart characteristics:
| Feature | Value |
|---|---|
| Series view type | BoxPlotSeriesView |
| Diagram type | 2D XYDiagram |
| Number of arguments per series point | 1 |
| Number of values per series point | 7 |
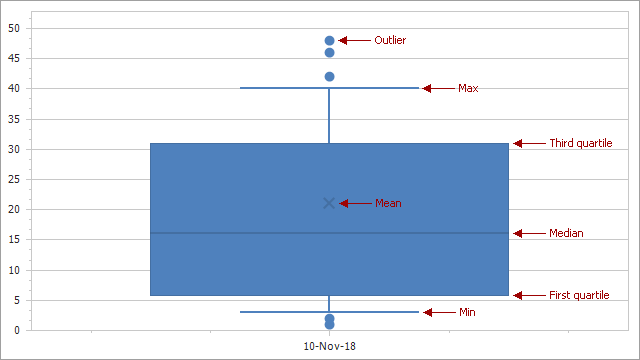
The following image shows the Box Plot chart elements:
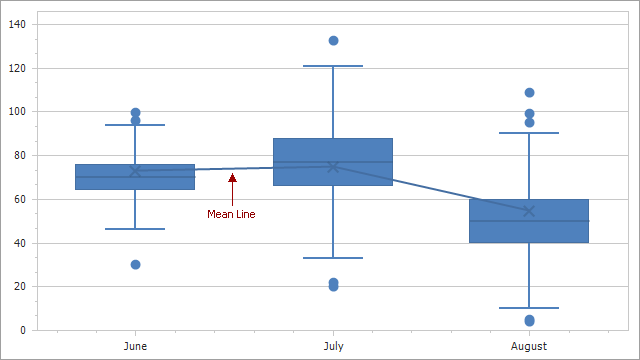
You can also display the series Mean line. Set the BoxPlotSeries2D.MeanLineVisible property to true for this:
Limitations
- The Box Plot series view does not support series labels.
- Box plot points cannot be aggregated.
Create a Box Plot Chart
The following example creates a Box Plot chart with three points:
- Add a chart to the WinForms project and specify the chart’s data source.
- Create a new series and add it to the chart. Set its view type to BoxPlot.
Specify data members for the series.
You can call the SeriesBase.SetBoxPlotDataMembersWithOutliers method to pass all the data member names as parameters. To create a chart without outliers, use the SeriesBase.SetBoxPlotDataMembers method.
To keep the Mean parameter undefined, pass the MeanDataMember parameter as null or an empty string to the SeriesBase.SetBoxPlotDataMembersWithOutliers (SeriesBase.SetBoxPlotDataMembers) method. If you manually add SeriesPoint objects to the Points collection, you can set the SeriesPoint.Values[5] value to double.NaN, DateTime.MinValue or TimeSpan.Zero.
using DevExpress.XtraCharts;
using System;
using System.Collections.Generic;
using System.Drawing;
using System.Windows.Forms;

namespace BoxPlotChart {
    public partial class Form1 : Form {
        public Form1() {
            InitializeComponent();
        }
        private void Form1_Load(object sender, EventArgs e) {
            Series series = new Series("Box Plot", ViewType.BoxPlot);
            series.DataSource = DataPoint.GetDataPoints();
            series.SetBoxPlotDataMembersWithOutliers("Argument", "Min", "Quartile1", "Median", "Quartile3", "Max", "Mean", "Outliers");
            chartControl1.Series.Add(series);
        }
    }
    public class DataPoint {
        public string Argument { get; set; }
        public double Min { get; set; }
        public double Max { get; set; }
        public double Quartile1 { get; set; }
        public double Quartile3 { get; set; }
        public double Median { get; set; }
        public double Mean { get; set; }
        public double[] Outliers { get; set; }
        public DataPoint(string argument, double min, double max, double q1, double q3, double median, double mean, double[] outliers) {
            this.Argument = argument;
            this.Min = min;
            this.Max = max;
            this.Quartile1 = q1;
            this.Quartile3 = q3;
            this.Median = median;
            this.Mean = mean;
            this.Outliers = outliers;
        }
        public static List<DataPoint> GetDataPoints() {
            List<DataPoint> data = new List<DataPoint> {
                new DataPoint("June", 46, 94, 64, 76, 70, 73, new double[]{ 30, 96.3, 99.56 }),
                new DataPoint("July", 33, 121, 66, 88, 77, 75, new double[]{ 20, 22, 132.7 }),
                new DataPoint("August", 10, 90, 40, 60, 50, 55, new double[]{ 4, 5, 95.4, 99.3, 109 })
            };
            return data;
        }
    }
}
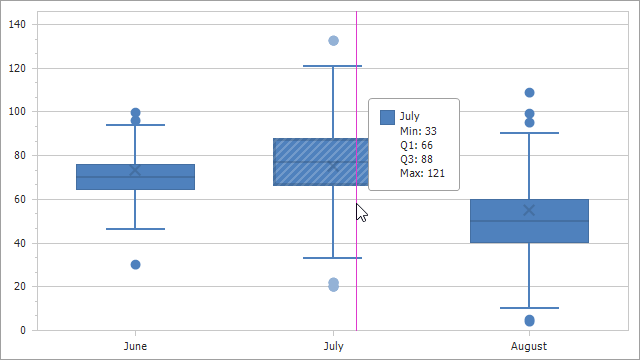
Format the Crosshair Label
Use the SeriesBase.CrosshairLabelPattern property to format the crosshair label text.
The Chart Control provides the following placeholders that you can use in patterns:
| Placeholder | Description |
|---|---|
| {BP_MIN} | Displays the Box Plot point’s Minimum value. |
| {BP_Q1} | Displays the Box Plot point’s First Quartile value. |
| {BP_MDN} | Displays the Box Plot point’s Median value. |
| {BP_AVG} | Displays the Box Plot point’s Mean value. |
| {BP_Q3} | Displays the Box Plot point’s Third Quartile value. |
| {BP_MAX} | Displays the Box Plot point’s Maximum value. |
series.CrosshairLabelPattern = "{A}" + Environment.NewLine +
    "Min: {BP_MIN}" + Environment.NewLine +
    "Q1: {BP_Q1}" + Environment.NewLine +
    "Q3: {BP_Q3}" + Environment.NewLine +
    "Max: {BP_MAX}";
You can use format specifiers to format values that the placeholders show. For example, the “{BP_Q1:f1}” pattern displays the First Quartile value with one digit after a comma.
Change Chart Appearance
This section explains how to modify the Box Plot chart appearance as follows:
The BoxPlotSeriesView class exposes the following appearance settings for the Box Plot chart:
- SeriesViewBase.Color - Gets or sets the color of the series.
- BoxPlotSeriesView.CapWidthPercentage - Gets or sets the cap width of a Box Plot series point as percentage.
- BoxPlotSeriesView.MeanAndMedianColor - Gets or sets a color of the Mean symbol and Median line.
- BoxPlotSeriesView.MeanMarkerKind - Gets or sets the Mean value’s marker kind.
- BoxPlotSeriesView.MeanMarkerSize - Gets or sets the Mean value’s marker size in pixels.
- BoxPlotSeriesView.Border - Returns the border settings for a Box Plot series point.
- BoxPlotSeriesView.LineThickness - Gets or sets the thickness of the line used to draw the box plot whiskers, median line and caps.
- BoxPlotSeries2D.MeanLineStyle - Specifies Mean line style settings. See the following help topic for more information about line style settings: LineStyle.
BoxPlotSeriesView view = series.View as BoxPlotSeriesView;
view.Color = Color.CadetBlue;
view.CapWidthPercentage = 50;
view.MeanAndMedianColor = Color.Black;
view.MeanMarkerKind = MarkerKind.ThinCross;
view.MeanMarkerSize = 10;
view.Border.Color = Color.Black;
view.Border.Thickness = 1;
view.Border.Visibility = DevExpress.Utils.DefaultBoolean.True;
view.LineThickness = 1;
view.MeanLineVisible = true;
view.MeanLineStyle.Thickness = 2;
view.MeanLineStyle.DashStyle = DashStyle.Dash;