A newer version of this page is available. .

Gantt Control

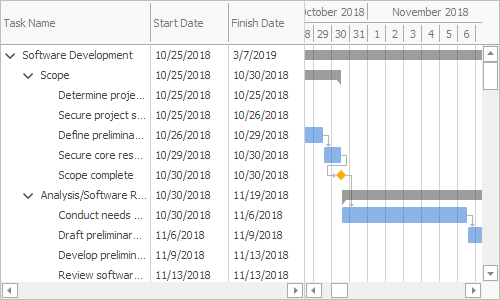
The GanttControl represents a Gantt chart — a bar chart that illustrates a project schedule. The control consists of a task list and a chart that shows task start and finish dates, progress, and dependencies.

Learn the Basics

  • Overview

    Describes the available features and end-user capabilities.

Data Source

  • Data Source

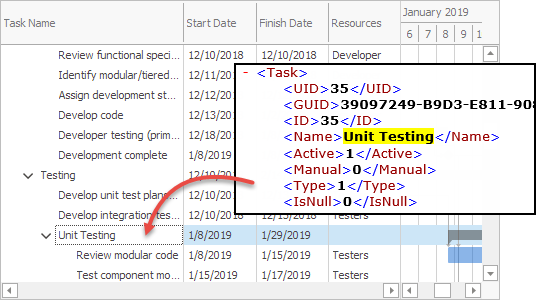
    Learn how to bind the control to a data source and specify the data source fields that contain task names, start and finish dates, dependencies, etc. The control supports multiple data source types.

Customization