Pivot Grid
- 8 minutes to read
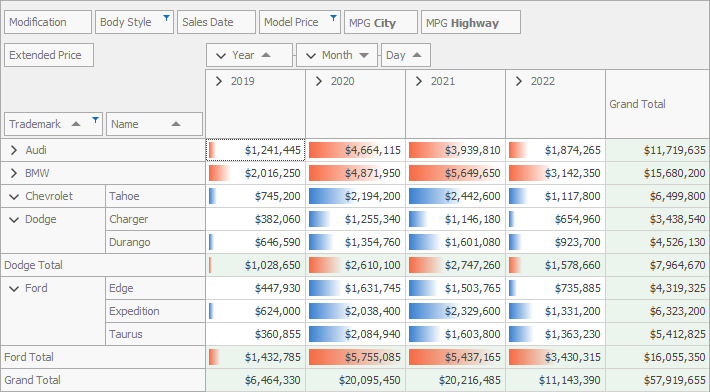
The DevExpress WinForms Pivot Grid allows you to create an Excel-like pivot table for multi-dimensional data analysis. PivotGridControl summarizes large amounts of data in a cross-tabular format and ships with numerous data-shaping and data-analysis features that allow you to group, filter, sort, highlight, and analyze the resulting data. Users can execute simple drag-and-drop operations in the UI to customize the Pivot Grid layout (for example, change the layout of fields and data cells, group multiple fields to display data hierarchically at multiple detail levels). The Pivot Grid supports drill-down (to view the underlying data for calculated cells), and printing and exporting to various file formats (such as PDF, XLS and XLSX).
Quick Start
Create a WinForms application with the Pivot Grid with these step-by-step tutorials:
- Pivot Grid Walkthroughs (.NET Framework)
- Tutorials in this section explain how to get started with the Pivot Grid.
- Bind a Pivot Grid to an OLAP Cube
- Contains step-by-step instructions on how to bind the Pivot Grid to an existing OLAP (OnLine Analytical Processing) cube.
Learn Basics
If you are a first-time user, you can explore the following topics for basic information on the purpose and functionality of the Pivot Grid:
- Information Presentation Basics
- Explains how the Pivot Grid presents data and why this data presentation format may be important to you.
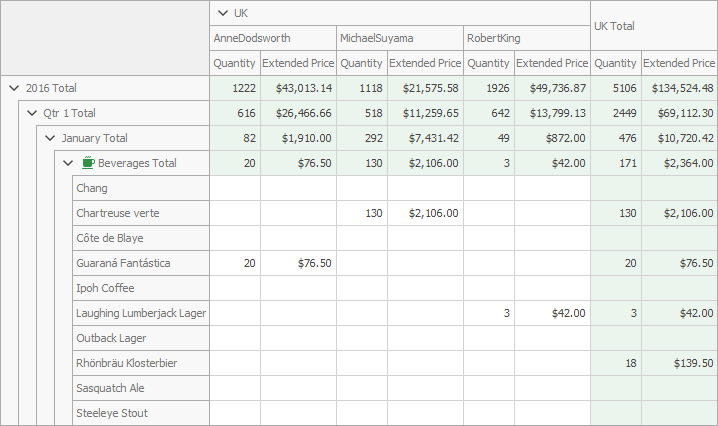
- Hierarchical Value Presentation
- Describes how to turn a single-level data presentation into a hierarchy to display data at multiple detail levels.
- Pivot Grid Fields
- Introduces the key part that allows you to visualize data in the Pivot Grid - a Pivot Grid field.
- Pivot Grid Data Processing Modes
- Contains data processing modes that the Pivot Grid uses to process data. The data processing mode determines how the Pivot Grid executes data aggregation and filter operations.
Bind to Data
You can connect the Pivot Grid to different data sources:
- ADO.NET Data
- SQL Data
- Excel Data Source
- Unbound Data Source
- Entity Framework (EF) Data
- Entity Framework (EF) Core
- LINQ to SQL
- MongoDB
- JSON
- WCF Data Services
- OData V4
- XPO Data Source
- IList and IEnumerable Data Sources
- XML Data
- OLAP Cube
- BindingSource Component
With the integrated Data Source Configuration Wizard, you can bind the Pivot Grid without writing a single line of code.
The Pivot Grid visualizes data through Pivot Grid Fields. You can use data source columns, calculated expressions, or window calculations as data binding sources for Pivot Grid fields.
Read the following topic for information on supported technologies and data sources: Data Binding.
Asynchronous Mode
The Pivot Grid can retrieve data from the server, group and filter data, and calculate summaries in a background thread. This allows the application to stay responsive while these operations are in progress.
Refer to the following topic for details: Asynchronous Mode.
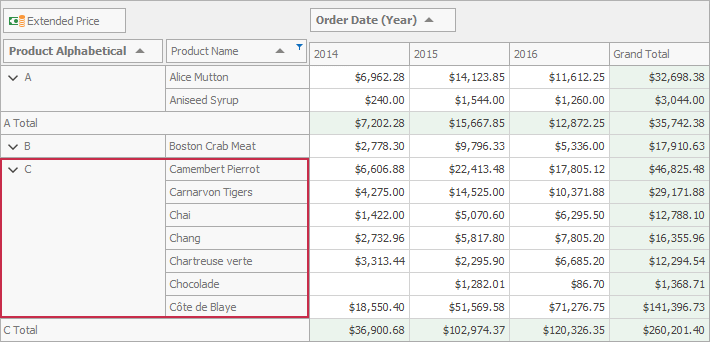
Group Data
You can group date/time, numeric, and string field values displayed in the Pivot Grid.
Data grouping features include:
- Grouping Fields
- Custom Grouping
- Interval Grouping
- Group Data by Field Values or Display Text
Refer to the following topic for details: Grouping.
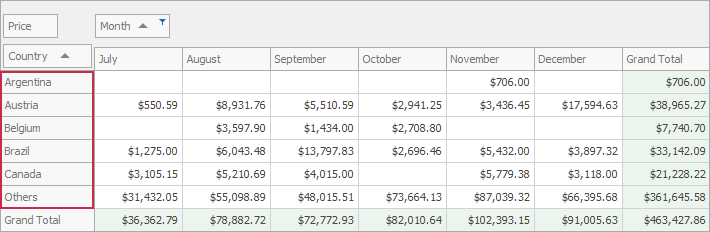
Sort Data
You can change the sort order of field values, limit the number of displayed field values, or sort field values by the corresponding summary value.
Data sorting features include:
- Sort by Field Values or Display Text
- Top N
- Sort by Summary
Refer to the following topic for details: Sorting.
Data Filtering and Search
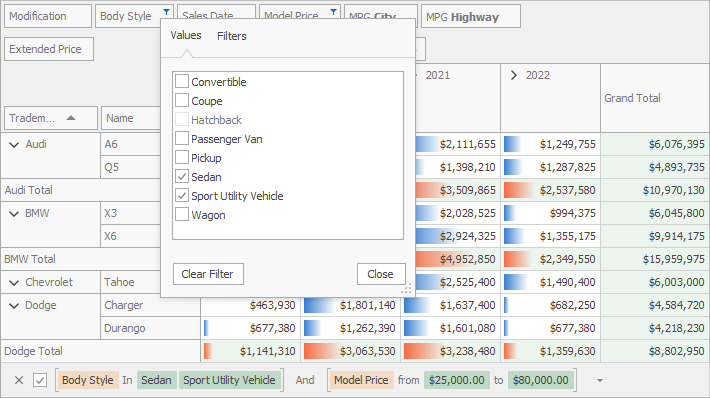
The Pivot Grid includes a comprehensive set of filter options and UI elements:
- Excel-Inspired Filter Dropdowns
- Group Filters
- Filter Criteria Editor
- Filter Panel
Refer to the following topic for details: Filtering.
Data Summaries
Pivot Grid cells display the results of summaries calculated against data fields.
The Pivot Grid supports the following data aggregation options:
- Automatic Summaries (Average, Count, Min, Max, Sum)
- Total Summaries (against all rows/columns)
- Custom Summaries
- Group Summaries (against grouped data)
- Format Summary Values
Refer to the following topic for details: Summaries.
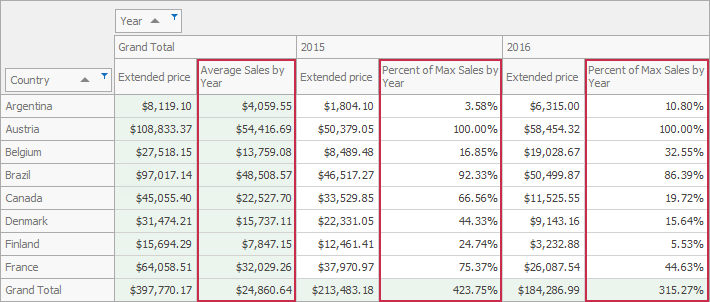
The Pivot Grid can display how cell values correlate to summary values in other cells instead of displaying raw summary results. For instance, the Pivot Grid allows you to display the percentage of totals and grand totals, or the absolute or percentage difference between current and preceding cells.
Refer to the following topic for details: Summary Display Types.
A Pivot Grid cell’s value is a summary calculated against a data field for a subset of records retrieved from the Pivot Grid’s underlying data source. You can obtain the underlying data source’s records that were used to calculate specific summary values.
Refer to the following topic for details: Drill Down to the Underlying Data.
Data Analysis
The Pivot Grid has powerful features and advanced functionality that help to organize, analyze, and interpret Pivot Grid data.
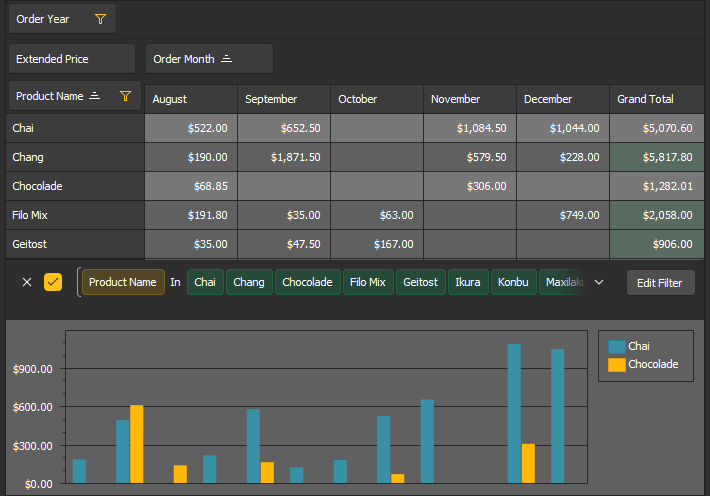
- Integration with the Chart Control
- Guides you on how to visualize Pivot Grid data in the Chart Control.
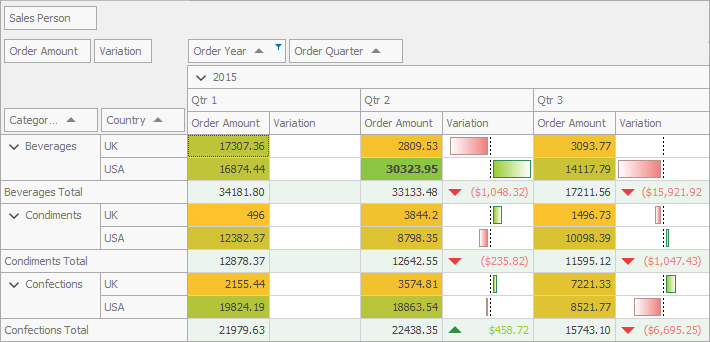
- Conditional Formatting
- The Pivot Grid includes a Microsoft Excel-inspired conditional formatting feature that allows you to change the appearance of individual cells based on specific conditions. This feature helps to highlight important information, identify trends and exceptions, and compare data.
- Key Performance Indicators
- Explains how to visualize KPI (key performance indicator) information to evaluate the success of a business in the Pivot Grid.
- Intermediate Level Aggregations
- Describes functions used to introduce additional aggregation levels to prepare underlying data.
- Window Calculations
- Describes the functionality used to calculate data across a set of window rows related to the current row.
- Custom Aggregate Functions
- The Pivot Grid supports custom aggregate functions that you can use to create aggregated expressions. These expressions allow you to implement custom logic for such features as custom summaries, grouping, and sorting.
Layout Management
You can arrange fields into groups, automatically adjust the column width to display its entire content, or invoke the customization form to manage the Pivot Grid’s layout in the UI.
The following layout features are supported:
- Field Groups
- Best Fit
- Pinned (Fixed) Columns
- Data Cell Layout
- Save and Restore Layout
- Customization Form
Print and Export
You can print and export Pivot Grid content to multiple file formats (HTML, MHT, PDF, RTF, DOCX, TXT, CSV, XLS, or XLSX).
See the following topics for detailed information and examples:
Focus and Selection
Besides mouse and keyboard selection, and navigation, Pivot Grid contains a set of API that allows you to scroll though Pivot Grid content and move focus to desired cells in code, so that users do not need to navigate through cells themselves. A focused cell’s contents can be copied to the Clipboard and pasted into other applications (for example, MS Excel or MS Word).
Refer to the following topic for details: Focus and Navigation.
Format Cell Values
Pivot Grid uses a formatting mechanism common to all DevExpress data-aware controls to format displayed values. Built-in text formatting options include:
- Composite Formatting
- HTML Text Formatting
- Custom Formatting
- Standard and Custom Format Specifiers
See the following topic for detailed information on how to format cells: Data Formatting.
Edit Data
Pivot Grid allows users to customize cells in cell editors. Users can edit cell values in in-place edit forms.
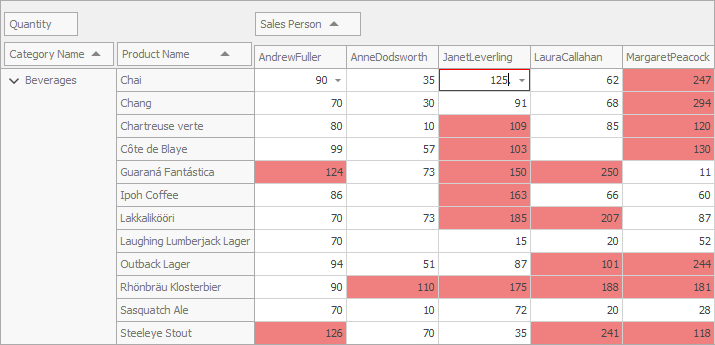
Refer to the following topic for details: Editing.
Appearance Customization
The Pivot Grid supports multiple appearance options/techniques that allow you to paint the Pivot Grid’s visual elements (buttons, field headers, cells, etc.), include a consistent look and feel, or paint the control manually.
Refer to the following topic for details: Appearance.
Design-Time Features
The Pivot Grid ships with a powerful Visual Studio IDE designer and intuitive customization interface designed to simplify setup. You can connect the Pivot Grid to a data source, and configure the Pivot Grid fields, layout, appearance settings, and printing options at design time.
Design-time UI/UX customization options include:
Miscellaneous
- Pivot Grid Performance
- Describes the Pivot Grid functionality that allows you to increase data processing speed.
- UI Elements
- Describes the Pivot Grid visual elements.
- Examples
- Lists the Pivot Grid examples, grouped by features.
- End-User Capabilities
- Describes the operations available to users in the Pivot Grid UI.
- Hints and Tooltips
- Explains how to manage hints (tooltips).
- Hit Information
- Describes how to determine which element is located at specific screen coordinates.
- Copy Data to the Clipboard
- Demonstrates how to copy the Pivot Grid’s data to a Clipboard.