Stock Chart
- 5 minutes to read
Short Description
The Stock Chart is represented by the StockSeriesView object, which belongs to Financial Series Views (which are also called Low-High-Open-Close).
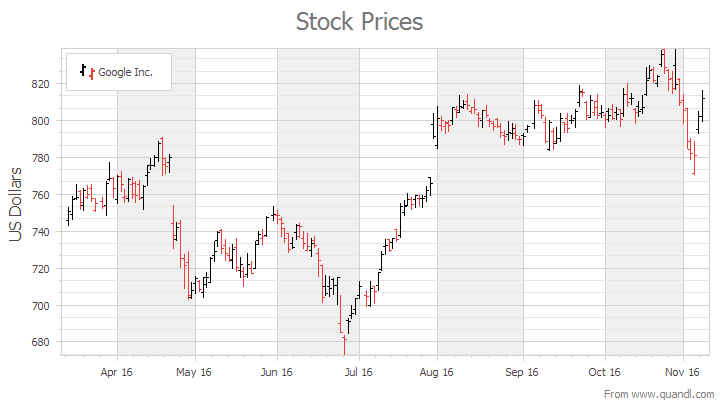
This view is used to show variation in stock prices over the course of a day. The Low and High prices are represented by the bottom and top values of the vertical line which is shown at each point, and the Open and Close prices are represented by left and right tick marks, correspondingly.
For Stock charts, you can choose for which price level (Low, High, Open, or Close) to enable the FinancialSeriesViewBase.ReductionOptions, meaning that in case the specified price is lower in comparison to the previous point’s value, the subsequent point is painted red (or any other color).
A Stock chart is shown in the image below. Note that this chart type is based upon the XYDiagram, so it can be rotated to show bars either vertically or horizontally.
To learn how to exclude holidays and weekends from an axis scale, refer to Work Time and Workday Configuration.
For more information, see Financial Charting.
Chart Type Characteristics
The table below lists the main characteristics of this chart type.
| Feature | Value |
|---|---|
| Series View type | StockSeriesView |
| Diagram type | 2D-XYDiagram |
| Number of arguments per series point | 1 |
| Number of values per series point | 4 (Low, High, Open, Close) |
Note
For information on which chart types can be combined with the Stock Chart, refer to the Series Views Compatibility document.
Example
This example creates a ChartControl with a series of the StockSeriesView type and adds this chart to a form at runtime. Before you proceed with this example, create a Windows Forms Application in Visual Studio and include all necessary assemblies in the References list of your project.
For more information about the features of financial charts, refer to the following help topic: Financial Charting
using System;
using System.Collections.Generic;
using System.Drawing;
using System.Windows.Forms;
using DevExpress.XtraCharts;
//...
    private void Form1_Load(object sender, EventArgs e) {
        // Create a new chart.
        ChartControl stockChart = new ChartControl();

        // Create a stock series.
        Series series1 = new Series("Series 1", ViewType.Stock);

        // Bind the series to data.
        series1.DataSource = GetDataPoints();
        series1.SetFinancialDataMembers("Argument", "Low", "High", "Open", "Close");

        // Specify that date-time arguments are expected.
        series1.ArgumentScaleType = ScaleType.DateTime;

        // Add the series to the chart.
        stockChart.Series.Add(series1);

        // Customize the series view settings.
        StockSeriesView view = (StockSeriesView)series1.View;

        view.LineThickness = 2;
        view.LevelLineLength = 0.25;

        // Specify the series reduction options.
        view.ReductionOptions.ColorMode = ReductionColorMode.OpenToCloseValue;
        view.ReductionOptions.Level = StockLevel.Close;
        view.ReductionOptions.Visible = true;

        // Set point colors.
        view.Color = Color.Green;
        view.ReductionOptions.Color = Color.Red;

        // Access the chart's diagram.
        XYDiagram diagram = (XYDiagram)stockChart.Diagram;

        // Exclude empty ranges from the X-axis range
        // to avoid gaps in the chart's data.
        diagram.AxisX.DateTimeScaleOptions.SkipRangesWithoutPoints = true;

        // Hide the range without points at the beginning of the y-axis.
        diagram.AxisY.WholeRange.AlwaysShowZeroLevel = false;

        // Hide the legend.
        stockChart.Legend.Visibility = DevExpress.Utils.DefaultBoolean.False;

        // Add a title to the chart.
        stockChart.Titles.Add(new ChartTitle());
        stockChart.Titles[0].Text = "Stock Chart";

        // Add the chart to the form.
        stockChart.Dock = DockStyle.Fill;
        this.Controls.Add(stockChart);
    }

    List<DataPoint> GetDataPoints() {
        List<DataPoint> dataPoints = new List<DataPoint> {
            new DataPoint(DateTime.Now.AddDays(-9), 24.00, 25.00, 25.00, 24.875),
            new DataPoint(DateTime.Now.AddDays(-8), 23.625, 25.125, 24.00, 24.875),
            new DataPoint(DateTime.Now.AddDays(-7), 26.25, 28.25, 26.75, 27.00),
            new DataPoint(DateTime.Now.AddDays(-6), 26.50, 27.875, 26.875, 27.25),

            new DataPoint(DateTime.Now.AddDays(-4), 25.75, 26.875, 26.75, 26.00),
            new DataPoint(DateTime.Now.AddDays(-3), 25.75, 26.75, 26.125, 26.25),
            new DataPoint(DateTime.Now.AddDays(-2), 25.75, 26.375, 26.375, 25.875),
            new DataPoint(DateTime.Now.AddDays(-1), 24.875, 26.125, 26.00, 25.375),
            new DataPoint(DateTime.Now.AddDays(0), 25.125, 26.00, 25.625, 25.75),
            };
        return dataPoints;
    }
}
public class DataPoint {
    public DateTime Argument { get; set; }
    public double Low { get; set; }
    public double High { get; set; }
    public double Open { get; set; }
    public double Close { get; set; }
    public DataPoint(DateTime arg, double low, double high, double open, double close) {
        this.Argument = arg;
        this.Low = low;
        this.High = high;
        this.Open = open;
        this.Close = close;
    }
}
Tip
A complete sample project is available in the DevExpress Code Examples database at https://supportcenter.devexpress.com/ticket/details/e1215/how-to-create-a-stock-chart.