Pie Chart
- 5 minutes to read
Short Description
The Pie Chart is represented by the PieSeriesView object, which belongs to Pie and Donut Series Views. This view is useful when it’s necessary to compare the percentage values of different point arguments in the same series, and to illustrate these values as easy to understand pie slices.
A Pie chart is shown in the image below. Note that if a chart contains several series of the PieSeriesView type, all these series are displayed in the same diagram according to the SimpleDiagram.Dimension and SimpleDiagram.LayoutDirection property values.
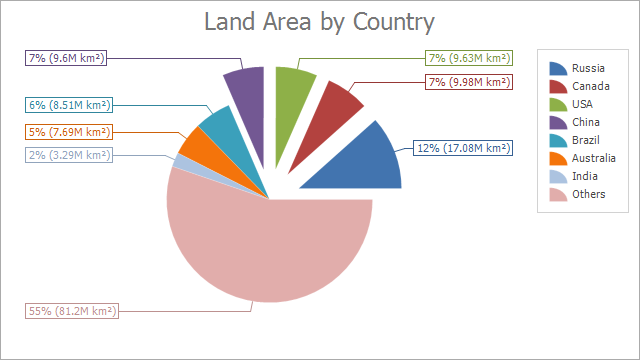
Chart Type Characteristics
The table below lists the main characteristics of this chart type.
| Feature | Value |
|---|---|
| Series View type | PieSeriesView |
| Diagram type | 2D-SimpleDiagram |
| Number of arguments per series point | 1 |
| Number of values per series point | 1 |
Note
For information on which chart types can be combined with the Pie Chart, refer to the Series Views Compatibility document.
Example
The following example demonstrates how to create a ChartControl with a series of the PieSeriesView type, and add this chart to a form at runtime.
Note that this series view type is associated with the SimpleDiagram type, and you should cast your diagram object to this type, in order to access its specific options.
using System;
using System.Collections.Generic;
using System.Windows.Forms;
using DevExpress.XtraCharts;

namespace Series_PieChart {
    public partial class Form1 : DevExpress.XtraEditors.XtraForm {
        public Form1() {
            InitializeComponent();
        }
        private void Form1_Load(object sender, EventArgs e) {
            // Create an empty chart.
            ChartControl pieChart = new ChartControl();

            pieChart.Titles.Add(new ChartTitle() { Text = "Land Area by Country" });

            // Create a pie series.
            Series series1 = new Series("Land Area by Country", ViewType.Pie);

            // Bind the series to data.
            series1.DataSource = DataPoint.GetDataPoints();
            series1.ArgumentDataMember = "Argument";
            series1.ValueDataMembers.AddRange(new string[] { "Value" });

            // Add the series to the chart.
            pieChart.Series.Add(series1);

            // Format the the series labels.
            series1.Label.TextPattern = "{VP:p0} ({V:.##}M km²)";

            // Format the series legend items.
            series1.LegendTextPattern = "{A}";

            // Adjust the position of series labels.
            ((PieSeriesLabel)series1.Label).Position = PieSeriesLabelPosition.TwoColumns;

            // Detect overlapping of series labels.
            ((PieSeriesLabel)series1.Label).ResolveOverlappingMode = ResolveOverlappingMode.Default;

            // Access the view-type-specific options of the series.
            PieSeriesView myView = (PieSeriesView)series1.View;

            // Specify a data filter to explode points.
            myView.ExplodedPointsFilters.Add(new SeriesPointFilter(SeriesPointKey.Value_1,
                DataFilterCondition.GreaterThanOrEqual, 9));
            myView.ExplodedPointsFilters.Add(new SeriesPointFilter(SeriesPointKey.Argument,
                DataFilterCondition.NotEqual, "Others"));
            myView.ExplodeMode = PieExplodeMode.UseFilters;
            myView.ExplodedDistancePercentage = 30;
            myView.RuntimeExploding = true;

            // Customize the legend.
            pieChart.Legend.Visibility = DevExpress.Utils.DefaultBoolean.True;

            // Add the chart to the form.
            pieChart.Dock = DockStyle.Fill;
            this.Controls.Add(pieChart);
        }
    }
    public class DataPoint {
        public string Argument { get; set; }
        public double Value { get; set; }

        public static List<DataPoint> GetDataPoints() {
            return new List<DataPoint> {
                    new DataPoint { Argument = "Russia",    Value = 17.0752},
                    new DataPoint { Argument = "Canada",    Value = 9.98467},
                    new DataPoint { Argument = "USA",       Value = 9.63142},
                    new DataPoint { Argument = "China",     Value = 9.59696},
                    new DataPoint { Argument = "Brazil",    Value = 8.511965},
                    new DataPoint { Argument = "Australia", Value = 7.68685},
                    new DataPoint { Argument = "India",     Value = 3.28759},
                    new DataPoint { Argument = "Others",    Value = 81.2}
                };
        }
    }
}