Lesson 1 - Create a Simple Unbound Chart
- 5 minutes to read
This example demonstrates how to construct a chart at design time within Visual Studio with manually created and populated series.
To create a simple unbound chart, do the following.
Create a Chart and Add Series to it
- Start MS Visual Studio 2012, 2013, 2015, 2017 or 2019, and create a new Windows Forms Application or open an existing one.
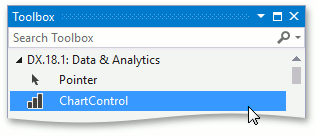
From the DX.19.1: Data & Analytics toolbox tab, drop the ChartControl onto the form.
Note that after you drop the Chart, the Chart Wizard may be invoked (if its “Display a wizard every time a new chart is added” option is enabled). In this example, we don’t need to use the Wizard, so click Cancel to close its window.
Note
For the chart to occupy all of the available space on the form, click the chart’s smart tag, and in its actions list, click Dock in Parent Container.
Important
Note that the DashboardDesigner control does not support .NET Framework 4.0 Client Profile. To learn how to target a version of the .NET Framework, see How to: Target a Version of the .NET Framework.
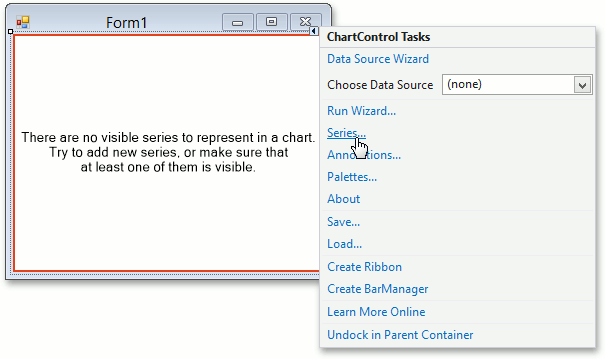
To add a new series to the chart, click the chart’s smart tag, and in its actions list, click the Series… link.
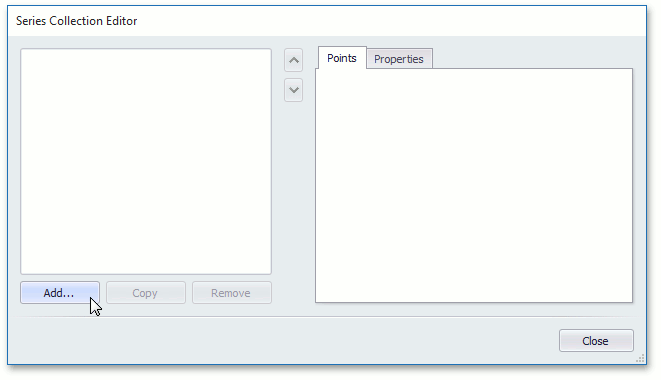
Then, in the invoked Series Collection Editor, click Add….
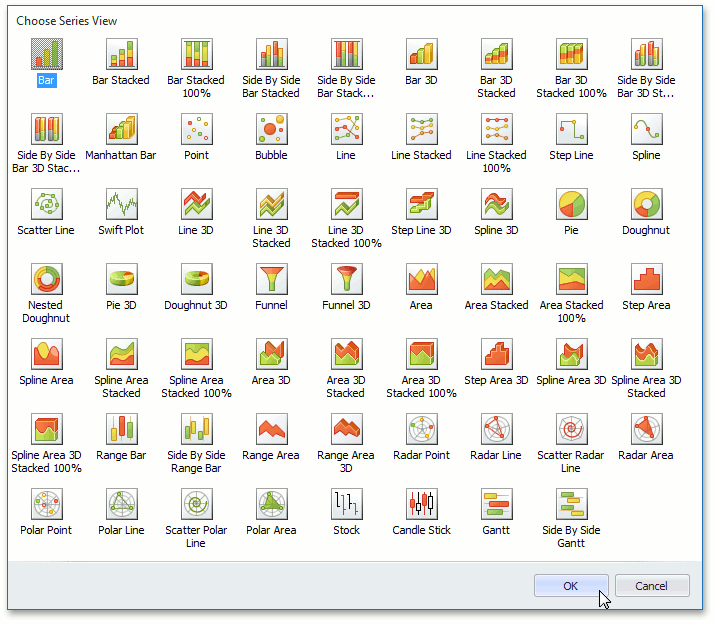
In the Choose Series View dialog, specify the view type of the series being created.
Note that the view type of the first visible series in the chart’s collection determines its diagram type.
For example, choose the Bar series, for the chart to get the XY-type.
Note
The available view types are listed in 2D Series Views and 3D Series Views.
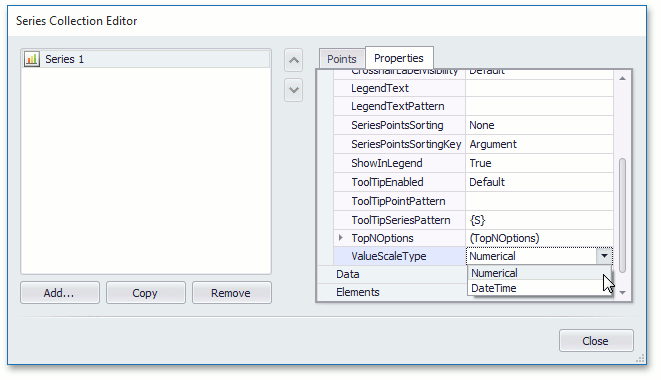
XtraCharts automatically detects the data type of series arguments. This means that you don’t need to specify the SeriesBase.ArgumentScaleType property before providing data for a chart, because it is set to Auto by default. Just make sure the default value of the SeriesBase.ValueScaleType property meets your requirements for some view types. Otherwise, select another value scale type (e.g., for the Bar series view).
You can perform this in the Properties tab of the dialog.
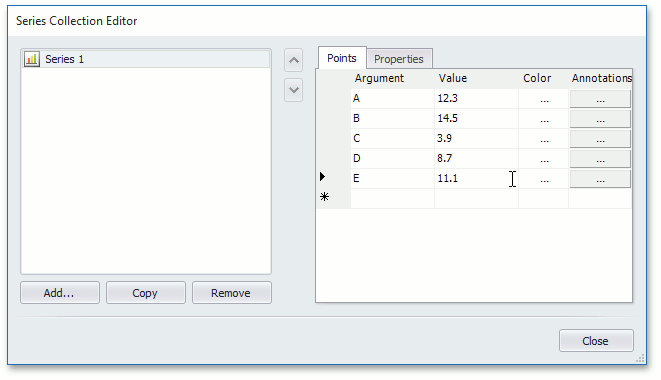
To manually add points to your series, switch back to the Points tab. Although, some series view types may require more than one value for each point’s argument (e.g., in Bubble or Stock series), it’s more typical for a point to have only an argument and value pair, which correspond to the point’s X and Y coordinates along the appropriate axes.
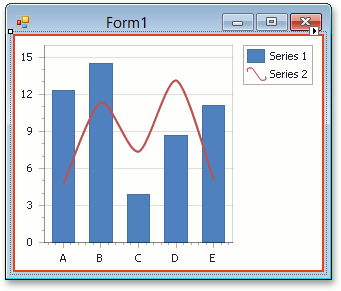
In your chart, you can create as many different series as required. Moreover, you can combine series of different view types within the same chart, if these view types are compatible. For example, add a Spline series.
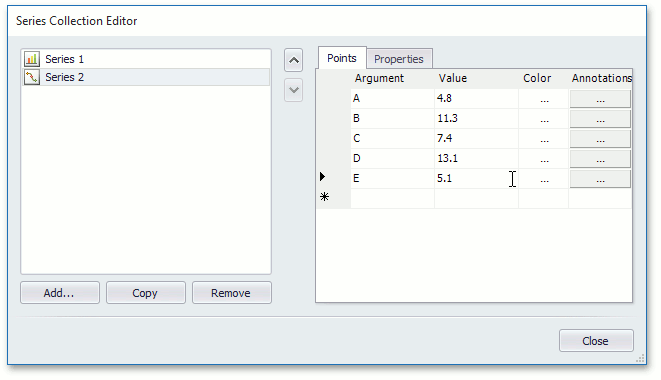
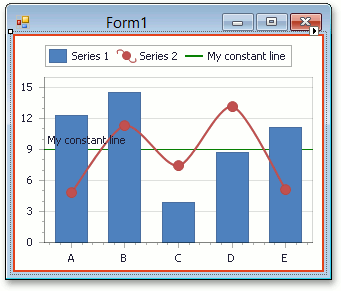
To apply the changes and quit the dialog, click Close. Now, your chart has two different series, populated with points.
The chart will look like the following image.
Customize the Chart
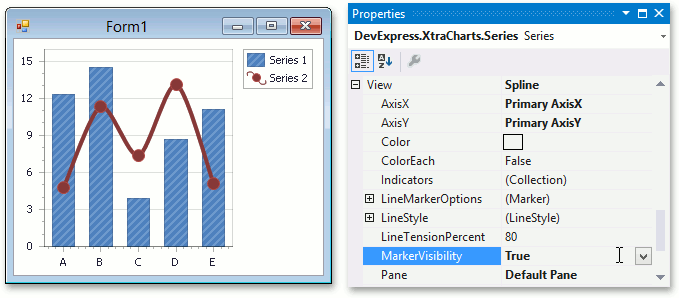
Enable Data Point Markers
Note that by default, data point markers are hidden. Let’s display markers on a diagram.
To do this, for Series 2, set the SplineSeriesView.MarkerVisibility property to true.
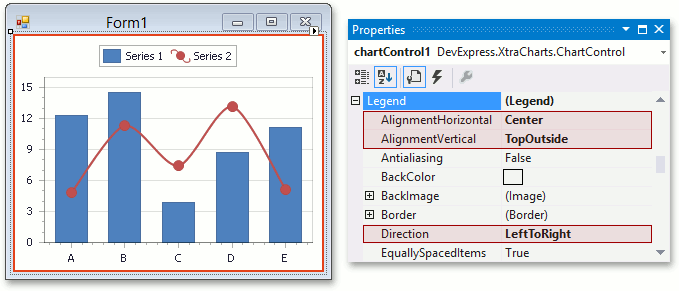
Customize the Legend
By default, the chart’s legend is shown in the top-right corner of the chart. To change the legend position, expand the ChartControl.Legend property, and set its Legend.AlignmentHorizontal property to Center, Legend.AlignmentVertical to TopOutside, and Legend.Direction to LeftToRight.
Add a Constant Line
To highlight a value across any axis, a Constant Line can be drawn through it. To do this, expand the ChartControl.Diagram property, and then its IXYDiagram2D.AxisY property in the Properties window. And click the ellipsis button for its Axis2D.ConstantLines property.
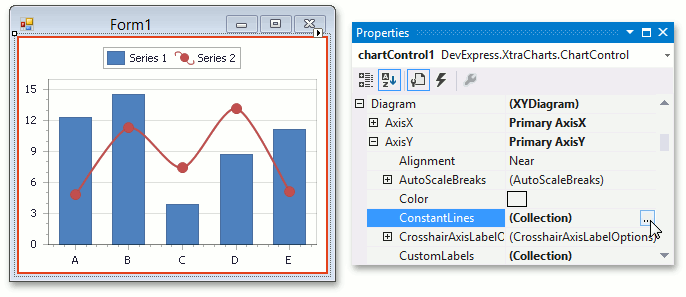
Then, in the Constant Line Collection Editor, click Add to create a constant line, specify its ConstantLine.AxisValue property, and adjust its remaining options.
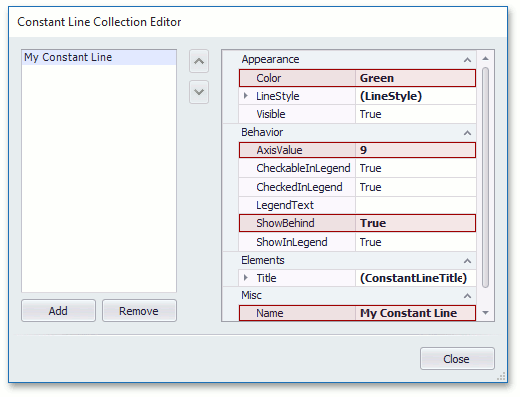
The result is illustrated in the following image.
Display Series in Different Panes
You can show each series (or group of series) in a separate pane. To do this, select the Spline series on a diagram. Then, in the Properties grid, expand the SeriesBase.View property and invoke the drop-down menu for the XYDiagramSeriesViewBase.Pane property, and click New pane.
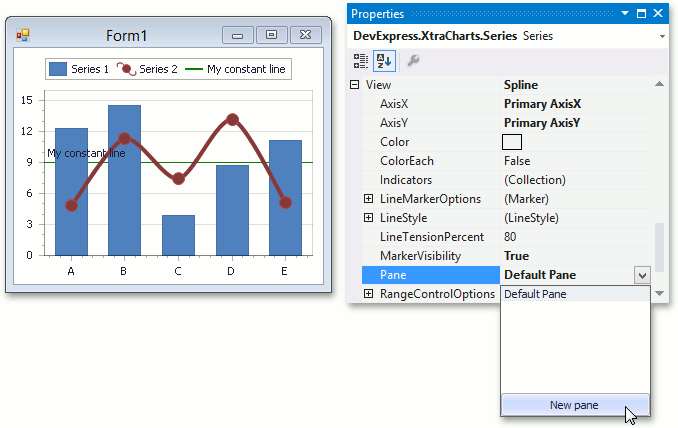
The result is illustrated in the following image.
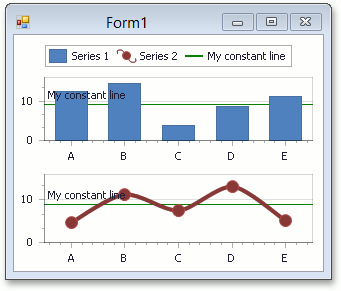
In addition, you can customize the axes visibility in the panes, and create secondary axes as well.
Customize the Crosshair Cursor
By default, a crosshair cursor is automatically displayed on a chart control at runtime. You can enable (disable) the crosshair cursor both at the level of a chart control using the ChartControl.CrosshairEnabled property, and at the level of a chart series via the SeriesBase.CrosshairEnabled property.
To demonstrate the second approach, let’s disable a crosshair label for the Bar series.
To do this, invoke the Series Collection Editor via the chart’s smart tag. Then, locate the SeriesBase.CrosshairEnabled property in the Series1’s Properties tab and set it to false.
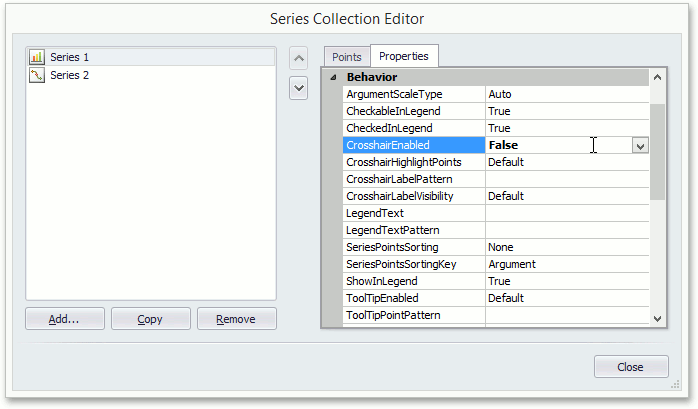
Note that you can also access this property in the Properties grid.
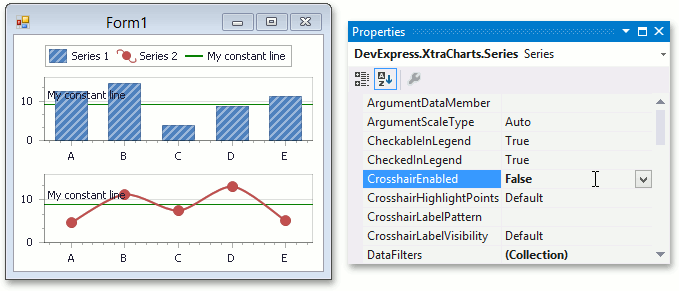
Run the application and make sure a crosshair label appears only for the Spline series.
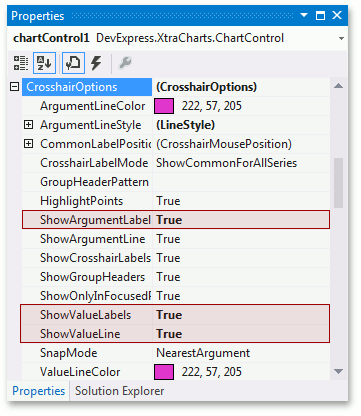
Let’s show crosshair axis lines and crosshair axis labels on a chart.
To accomplish this, locate the CrosshairOptions object in the Properties grid and set its CrosshairOptions.ShowValueLine, CrosshairOptions.ShowArgumentLabels and CrosshairOptions.ShowValueLabels properties to true, as shown below:
Run the application to see the result.