Lesson 3 - Bind Chart Series to Data
- 6 minutes to read
This tutorial demonstrates how to bind a chart to an external SQL data source in the Data Source Configuration Wizard, add a series to the chart, and adjust data bindings of the series.
Note
Refer to the following article for more information on how to connect a chart to different data source types: Data Source Wizard.
Follow the steps below to bind the chart to data and specify its series:
Prerequisites
Microsoft Visual Studio 2012, 2013, 2015, 2017 or 2019.
Create a Chart and Bind it to Data
Run Microsoft Visual Studio.
Create a new Windows Forms Application or open an existing one.
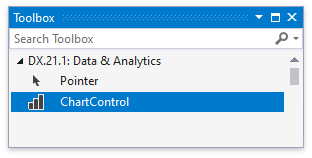
From the DX.21.2: Data & Analytics toolbox tab, drop the ChartControl onto the form.
The Chart Designer is invoked once you drop the Chart control on the form. You can disable the Chart Designer‘s “Display a wizard every time a new chart is added” option to not show this dialog. Click Cancel to close the Chart Designer.
To fill an entire form with the chart, click its smart tag, and select Dock in Parent Container in the invoked action list.
To define a data source for the chart, click its smart tag, and select Data Source Wizard.
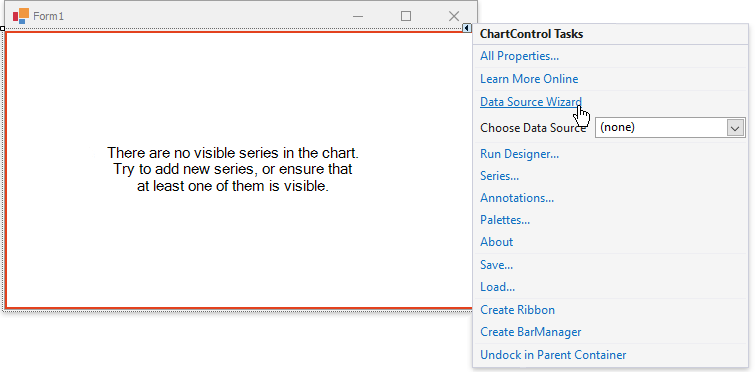
The Data Source Configuration Wizard appears where you can specify a data source.
Note
You can also use the Visual Studio Data Source Configuration Wizard to connect a chart series to a database. Refer to the following article for more information: How to: Bind Individual Chart Series to Data at Design Time.
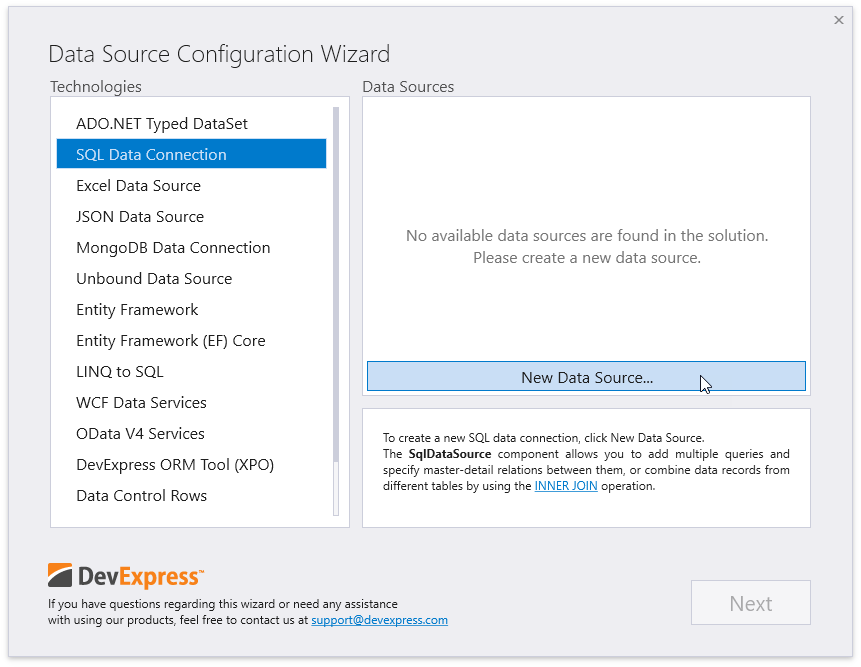
On the Wizard’s first page, select SQL Data Connection and click New Data Source… in the Data Sources window.
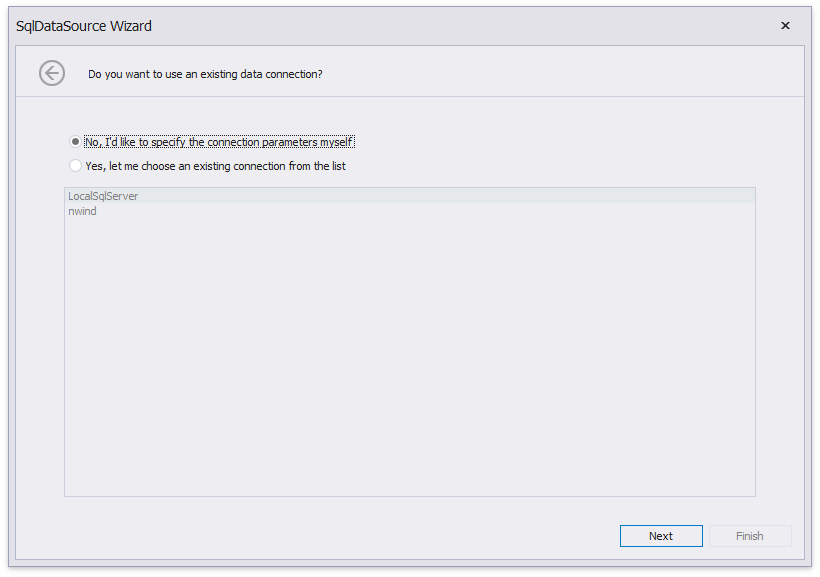
The following message appears:
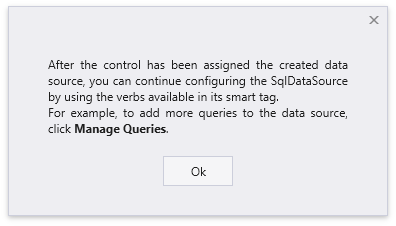
On this page, click No to create a new data connection.
Select the data provider and specify connection parameters. In the Database field, specify the following path to the Northwind database file:
C:\Users\Public\Documents\DevExpress Demos 21.2\Components\Data\nwind.mdb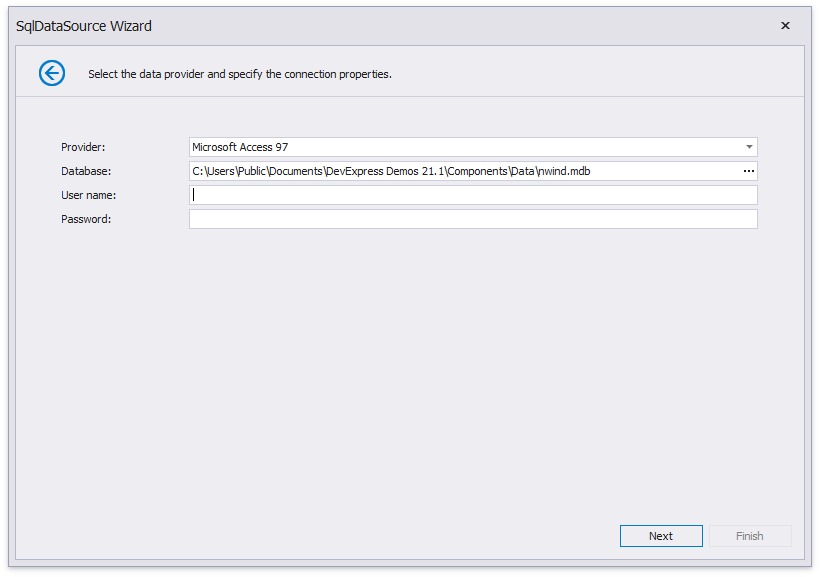
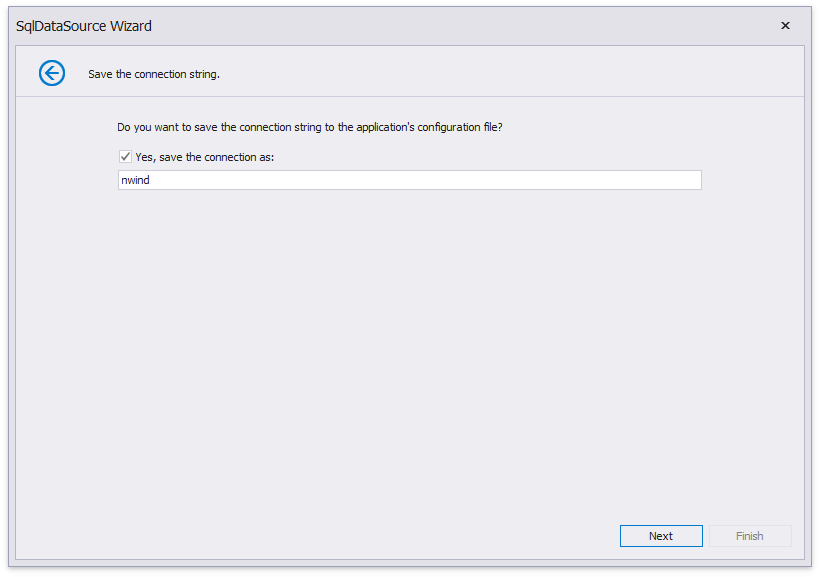
Click Next on the following page to save the created connection string to the configuration file.
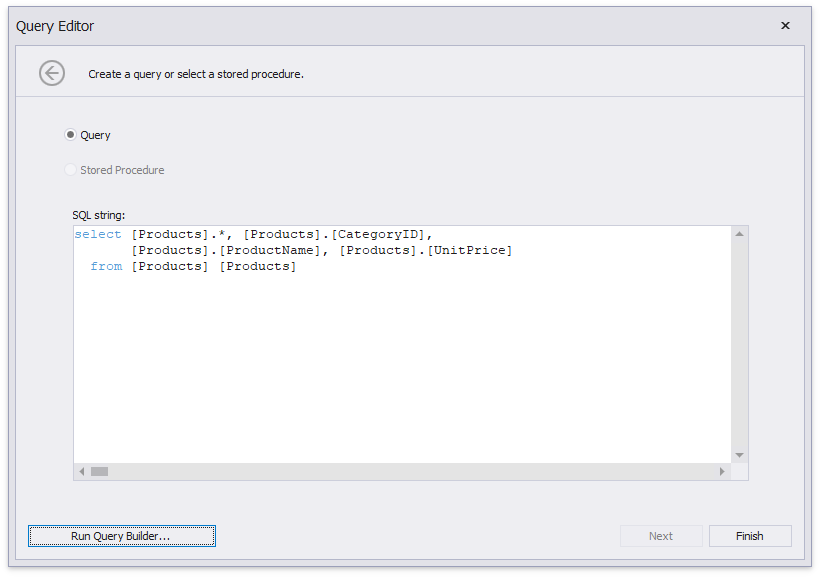
On this page, you can construct an SQL query to obtain data from the database, specify a custom query, or select a stored procedure.
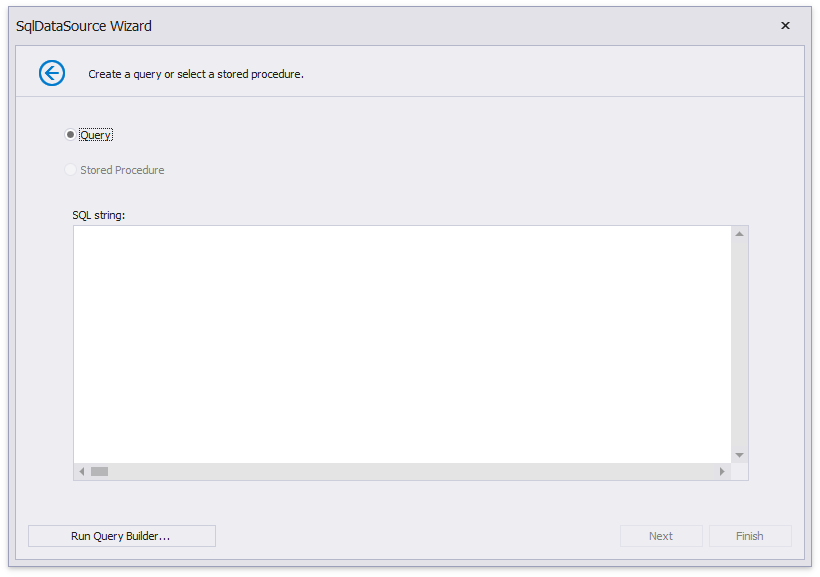
Click the Run Query Builder… button to invoke the Query Builder. The Query Builder allows you to configure the resulting SQL query.
Double-click or drag the Products table from the Tables pane onto the Diagram pane. Use the checkbox to include CategoryID, UnitPrice and ProductName fields in the resulting query.
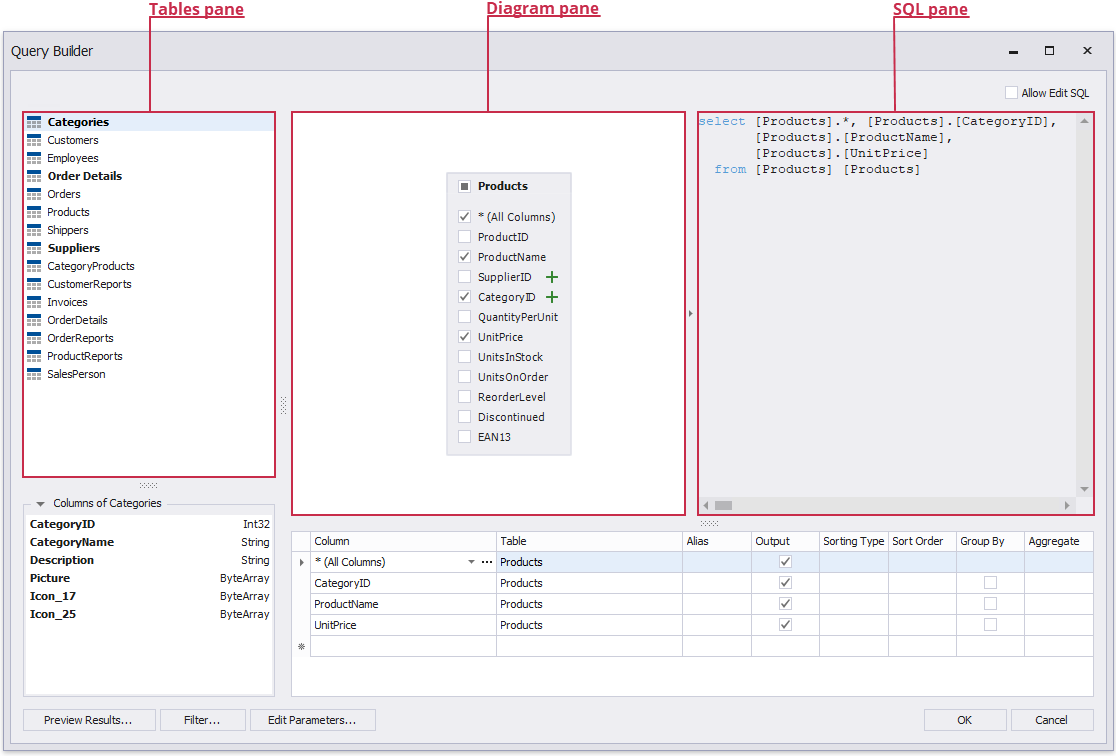
After you constructed the query in the Query Builder, the query string is passed to the Data Source wizard.
Click Finish to create the data source.
As a result, Visual Studio generates a set of classes for data management within the project.
- sqlDataSource1 is a SqlDataSource instance (a collection of tables, relationships, and constraints) that contains tables from the Northwind database.
- productsBindingSource is a BindingSource component, used to simplify data binding to sqlDataSource1. The data source is assigned to the ChartControl.DataSource property.
The sqlDataSource1 object’s fill method is automatically generated to load data from the data base.
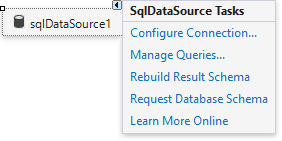
The chart is bound to data. If you need to update connection parameters, open the sqlDataSource1 component’s smart tag menu:
The next steps specify which data fields should be used to supply data for a chart series.
Specify a Series
Add series to the chart. Click the chart’s smart tag and choose the Series… link in the invoked action list.
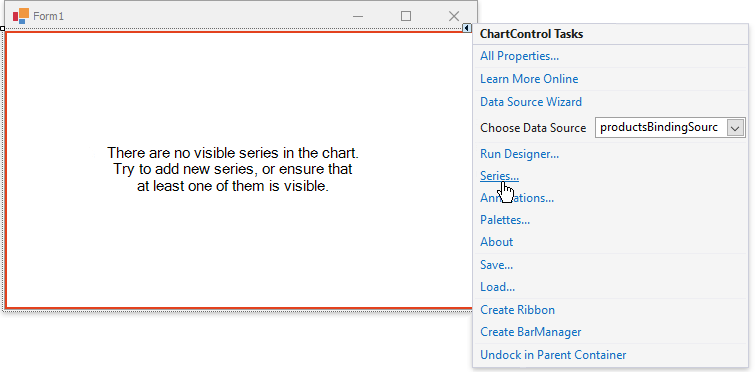
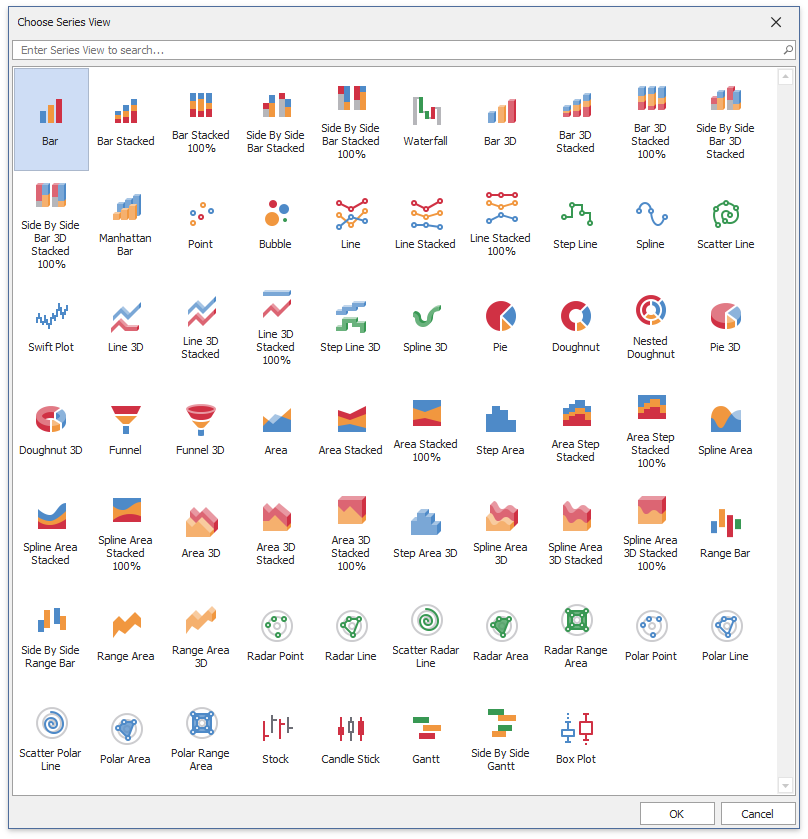
In the invoked Series Collection Editor, click Add…, and select the Bar view.
Once you create a series, the chart displays automatically generated data for a series preview until you run the application.
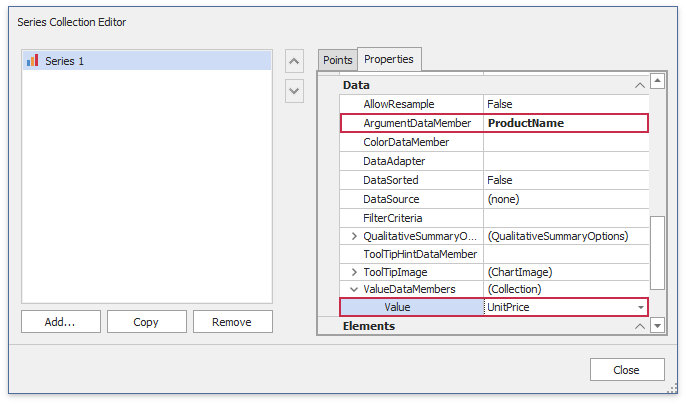
Switch to the Properties tab of the editor’s window and do the following:
- Set the SeriesBase.ArgumentDataMember property to the ProductName data field.
- Set the SeriesBase.ValueDataMembers property to UnitPrice.
Note
If a series uses the chart control’s data source, it is not necessary to define the Series.DataSource property because a series inherits the chart control’s data source settings. Specify this property when a series uses a different data source.
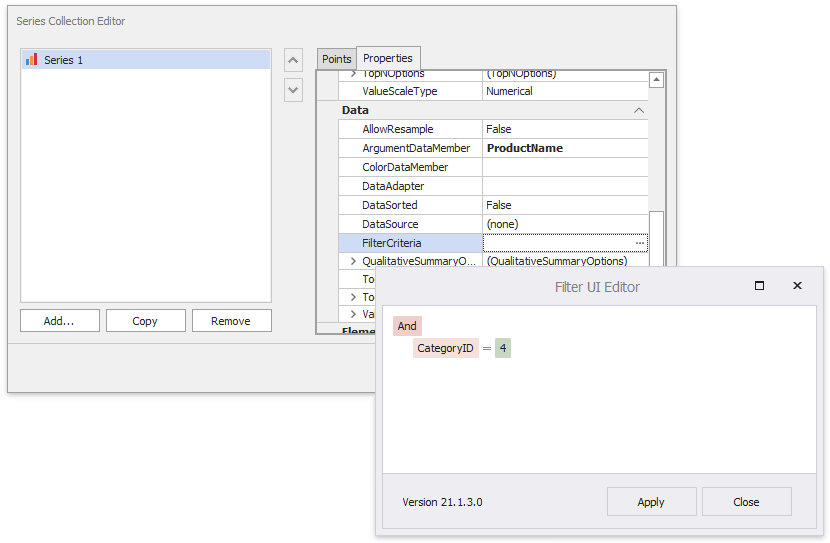
Filter data in the series. To do this, click the SeriesBase.FilterCriteria property’s ellipsis button.
In the invoked Filter UI Editor, click the plus button to add a new condition. Set the column name to CategoryID, the criteria operator to Equals, and the operand value to 4.
Customize the Chart
Adjust the following options:
Adjust the Series-View-Specific Options
You can color each Bar individually in the created series. To achieve this, select the series and in the Properties grid, expand its SeriesBase.View property. Locate and enable the SeriesViewColorEachSupportBase.ColorEach property among the set of the view type-specific options.
Then, invoke the pattern editor for the SeriesBase.LegendTextPattern property of the series. Set the property value to {A}: {V} to show both arguments and values in legend rows.
Adjust the Legend
Each data point is a separate item on the chart’s legend. The item displays a pair of point arguments and their values. To better position the legend, select it first. Then, set the LegendBase.Direction to LeftToRight, LegendBase.AlignmentHorizontal to Center, and LegendBase.AlignmentVertical to BottomOutside in the Properties grid.
Add the Chart Title
To create the chart’s title, click the ellipsis button for the ChartControl.Titles property in the chart’s Properties grid. Then, click Add in the invoked editor to generate a new title. Specify the Title.Text property value (“Product Prices Comparison” in this example) and other options.
Adjust the Series Point Labels
To show the series labels, enable the SeriesBase.LabelsVisibility property.
Adjust the Crosshair Cursor Options
Crosshair cursor labels and a crosshair argument line are displayed on the chart. You can use the ChartControl.CrosshairEnabled property to disable or enable a crosshair cursor at the chart’s level, and the SeriesBase.CrosshairEnabled property to do the same at the series level.
To show crosshair cursor value lines and crosshair cursor axis labels, set the CrosshairOptions.ShowValueLine, CrosshairOptions.ShowValueLabels, and CrosshairOptions.ShowArgumentLabels properties to true.
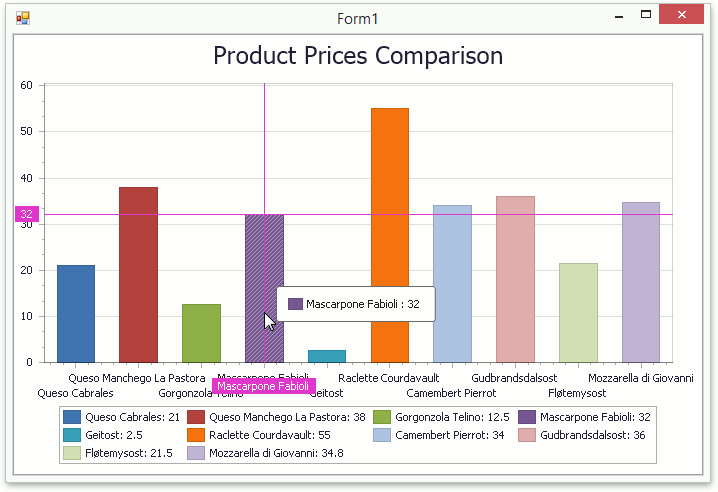
Get the Result
Run the application to see the result:
More Examples
- How to: Bind Individual Chart Series to Data at Run Time
- This tutorial explains how to bind each chart series to an individual data source in code.
- How to: Bind Individual Chart Series to Data at Design Time
- This tutorial explains how to bind each chart series to an individual data source at design time.
- How to: Specify Series Data Members
- This tutorial describes how to specify a data source for a created series, and automatically populate series points based on the data source table.