Lesson 3 - Bind Chart Series to Data
- 6 minutes to read
This tutorial demonstrates how to bind a chart to an external data source, manually add a series to the chart, and adjust its data bindings. This means that it is possible to provide an individual data source for each series.
To learn how to manually bind a chart’s series to data, do the following.
- Create a Chart and Bind it to Data
- Specify a Series Data Source
- Populate with Data at Design and Runtime
- Customize the Chart
- Get the Result
Create a Chart and Bind it to Data
- Start MS Visual Studio 2012, 2013, 2015, 2017 or 2019 and create a new Windows Forms Application or open an existing one.
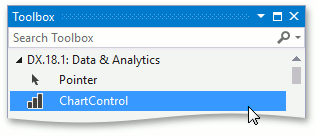
From the DX.19.1: Data & Analytics toolbox tab, drop the ChartControl onto the form.
In this instance, the Chart Wizard may be invoked (if its “Display a wizard every time a new chart is added” option is enabled). In this example, we don’t need to use the wizard, so click the Cancel button to close the Wizard and manually customize the chart.
Note
For the chart to occupy all the available space on the form, click the chart’s smart tag, and in its actions list, click Dock in Parent Container.
To define a data source for the chart, click its smart tag, and in its actions list, expand the Choose Data Source drop-down list and click on Add Project Data Source… link.
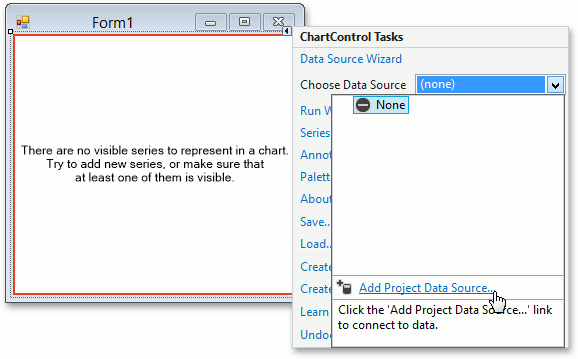
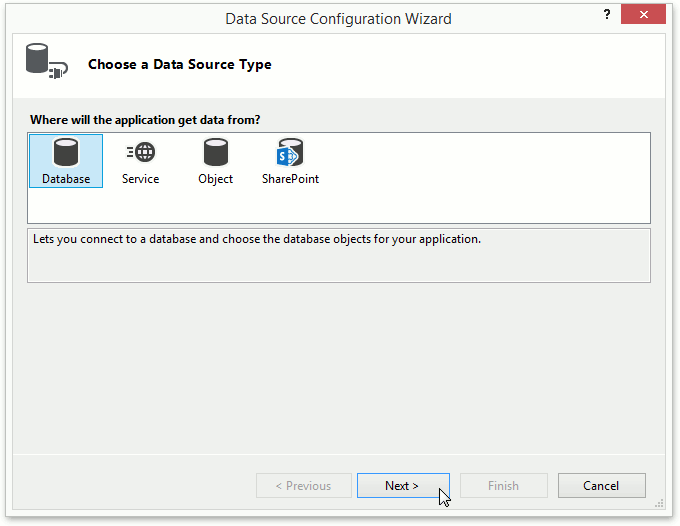
The Data Source Configuration Wizard appears. It allows you to select a data source.
In the Wizard’s first page, leave the data source type as Database and click Next.
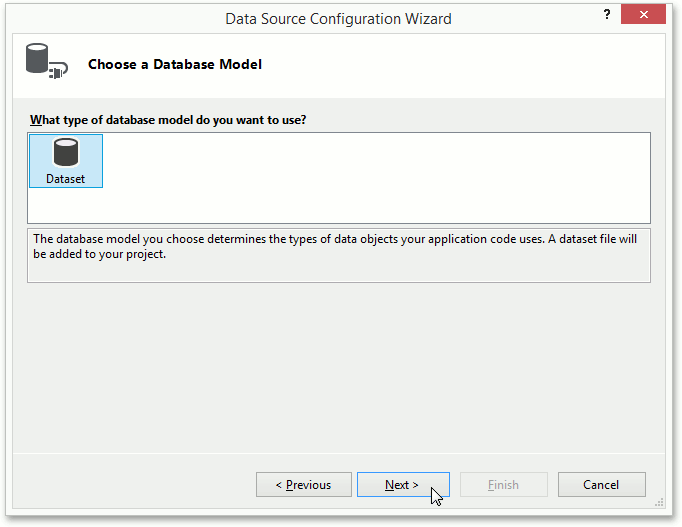
In the Choose a Database Model page, click Next.
On the following page, click New Connection….
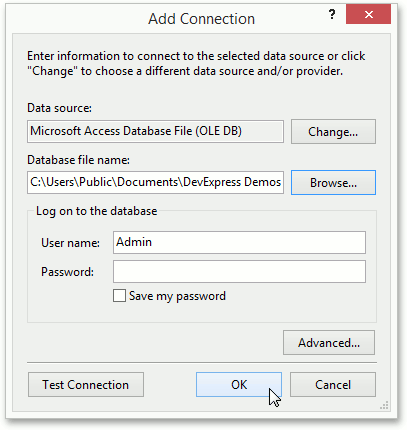
In the invoked Add Connection dialog:
- specify Microsoft Access Database File (OLE DB) as the database type in the Data source field. If necessary, use the Change… button to select between different types.
- In the Database file name field, specify the following path to the Northwind database file - C:\Users\Public\Documents\DevExpress Demos 19.1\Components\Data\nwind.mdb (leave the Password option blank). You can use the Browse… button to locate this file.
Click OK to close the dialog.
To proceed, click Next.
The following message will appear.
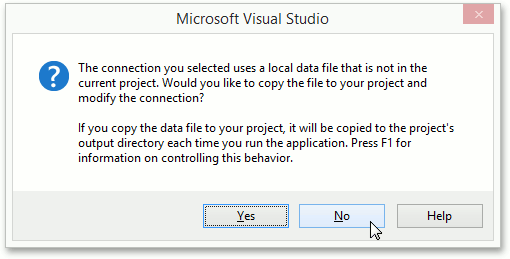
Select No, as this example is not intended to change database data.
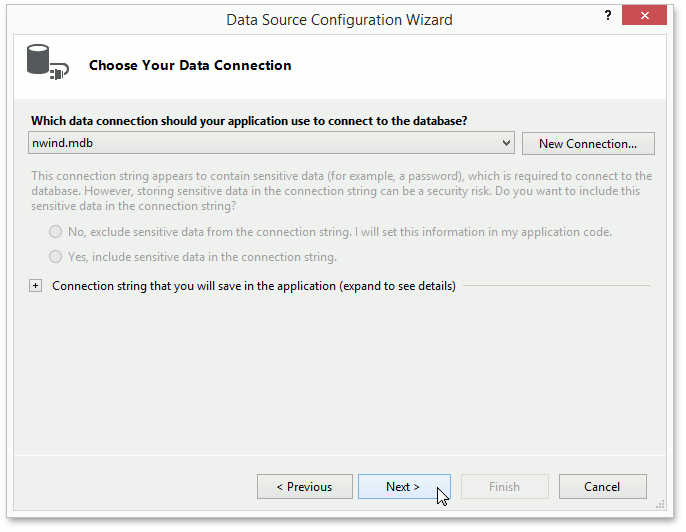
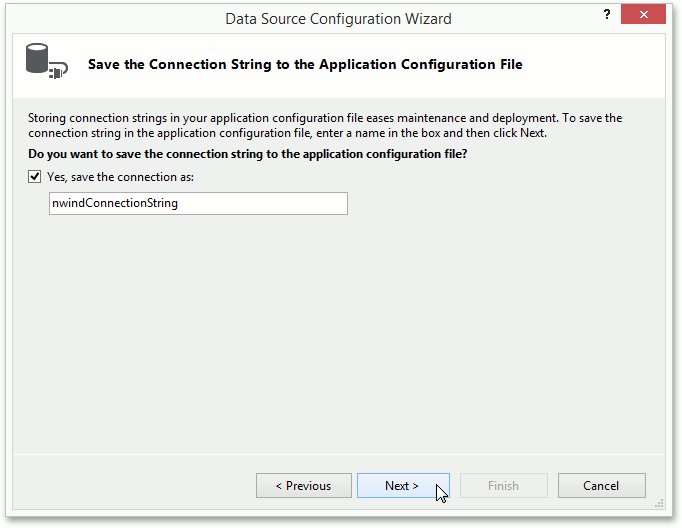
Click Next on the following page to save the created connection string to the configuration file.
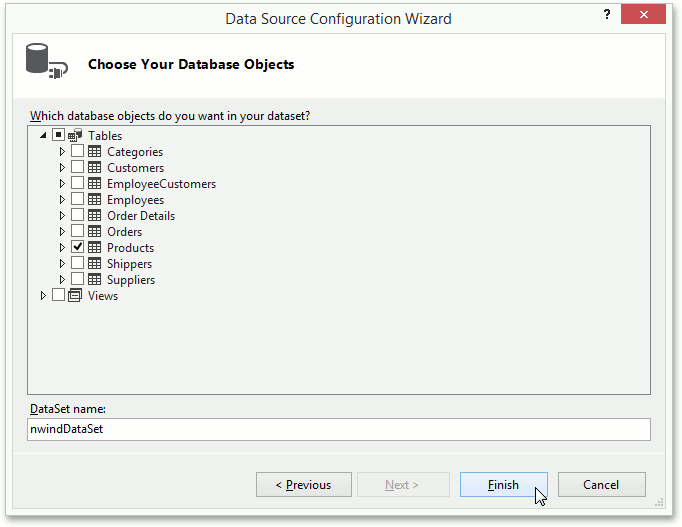
Select the “Products” table as shown below and click Finish.
As a result, Visual Studio will generate a set of classes for data manipulation within the project. The main ones are:
- nwindDataSet - represents a DataSet object (a collection of tables, relationships, and constraints), which contains the Products table from the Northwind database.
- productsTableAdapter - represents a TableAdapter object that provides communication between the application and a database. Its methods are used for executing queries and stored procedures, fetching data and filling DataTables in DataSets, and sending data back to the database. It is assigned to the ChartControl.DataAdapter property.
- productsBindingSource - represents a BindingSource component, used to simplify the data binding of the nwindDataSet to the ChartControl. It is assigned to the ChartControl.DataSource property.
Now, the chart has been bound to data. The next steps specify which data fields should be used to provide data for the chart’s series.
Specify a Series Data Source
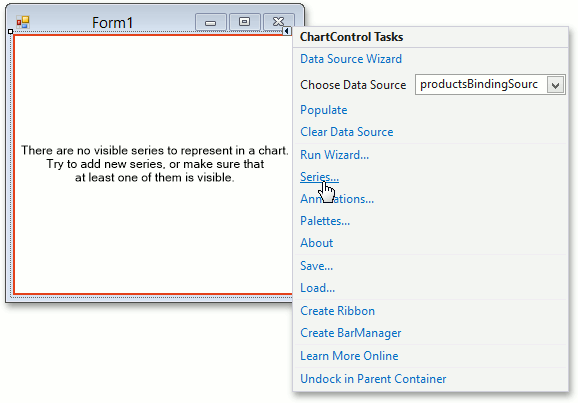
Now, let’s add series to the chart. To do this, click the chart’s smart tag and in its actions list, choose the Series… link.
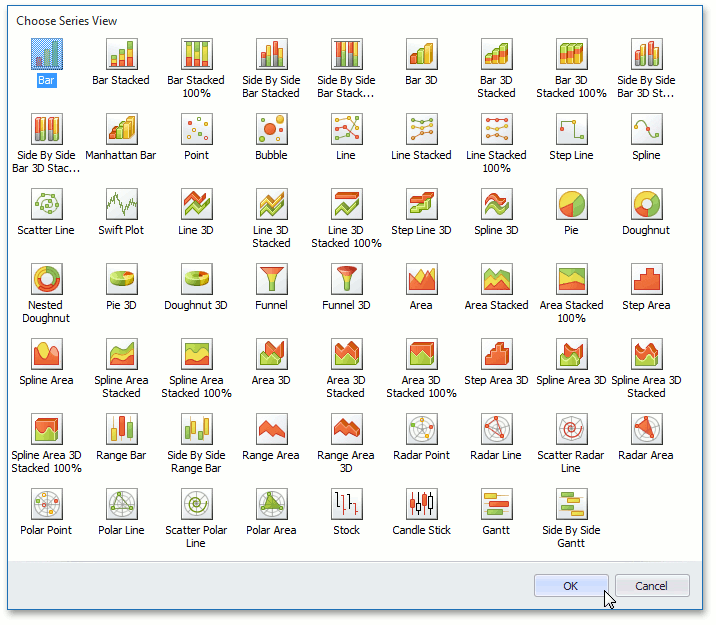
In the invoked Series Collection Editor, click Add…, and select the Bar view.
Note
After you create a series, the chart displays fake data to give you an idea of what the chart will look like after genuine data is provided.
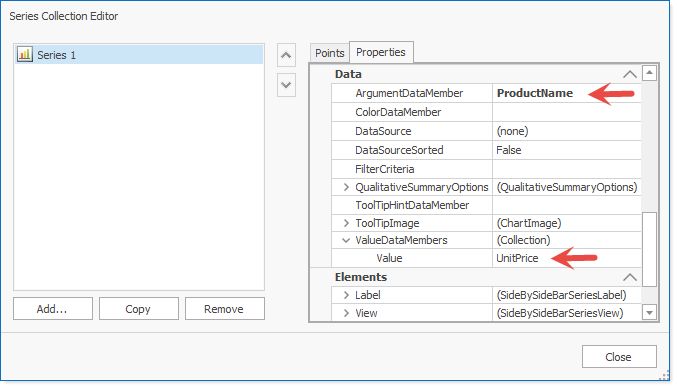
Now switch to the Properties tab on the right of the editor’s window and make the following assignments for the Series1 properties:
- set the SeriesBase.ArgumentDataMember property to the ProductName data field;
- and the only value of the SeriesBase.ValueDataMembers property to UnitPrice.
Note
In most scenarios, it is unnecessary to specify the Series.DataSource property.
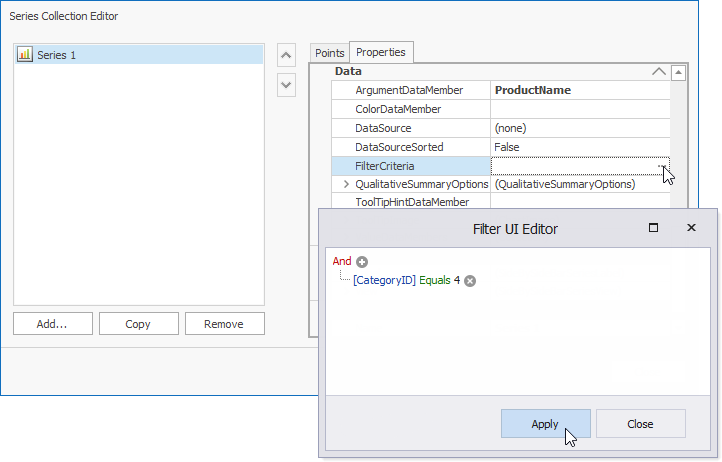
Limit the number of data points in the series. To do this, click the SeriesBase.FilterCriteria property’s ellipsis button.
In the invoked Filter UI Editor, use the plus button to add a new condition. Set the column name to CategoryID, the criteria operator to Equals, and the operand value to 4.
Populate with Data at Design and Runtime
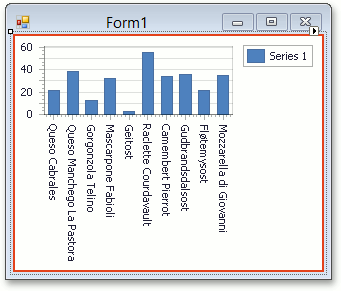
If you wish to see how the resulting chart will finally look at design time, click its smart tag, and in its actions list, click Populate. This will redraw the chart using genuine, obtained data.
At runtime, Visual Studio automatically adds the following code to the form’s Load event, and normally you don’t need to add it manually.
Customize the Chart
Now you can adjust the following options.
Adjust the series-view-specific options.
For the created series, it is possible to color each Bar individually. To achieve this, select the series and in the Properties grid, expand its SeriesBase.View property. Among the set of the view-type-specific options, locate and enable the SeriesViewColorEachSupportBase.ColorEach property.
Then, for the series’ SeriesBase.LegendTextPattern property invoke its pattern editor and set the property value to “{A}: {V}” to show both arguments and values in legend rows.
Adjust the legend.
Now, each data point is represented in the chart’s legend by a separate item, displaying a pair of point arguments and their values. To better position the legend, select it, and in the Properties grid, set its Legend.Direction to LeftToRight, Legend.AlignmentHorizontal to Center, and Legend.AlignmentVertical to BottomOutside.
Add a chart title.
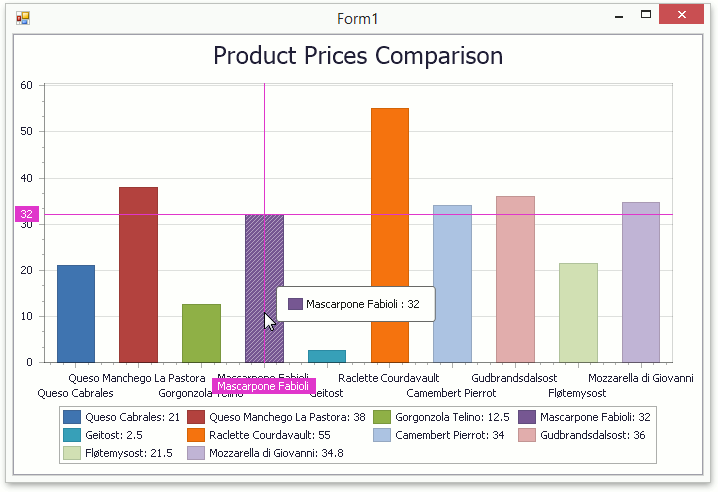
To create a title for your chart, select it, and in the Properties grid, click the ellipsis button for the ChartControl.Titles property. Then, in the invoked collection editor, click Add, and for the created title, set its Title.Text property value (e.g. “Product Prices Comparison”) and other options.
Adjust the series point labels.
To show the series labels, enable the SeriesBase.LabelsVisibility property.
Adjust the crosshair cursor options.
By default, crosshair cursor labels and a crosshair argument line are displayed on a chart. You can disable (enable) a crosshair cursor both at the level of a chart via the ChartControl.CrosshairEnabled property and at the level of a chart series using the SeriesBase.CrosshairEnabled property.
To show crosshair cursor value lines and crosshair cursor axis labels, set the CrosshairOptions.ShowValueLine, CrosshairOptions.ShowValueLabels, and CrosshairOptions.ShowArgumentLabels properties to true.
Get the Result
The result is illustrated in the following image.