Lesson 4 - Use a Series Template for Auto-Created Series
- 6 minutes to read
This tutorial demonstrates how to create a chart bound to data, so that all series are auto-created based on a common template, which specifies universal options for all series. This is possible when the data for all series (their names, along with points’ arguments and values) is stored in the same data table.
Note that in this scenario, the view type and certain other settings will be the same for all series.
In this example, we’ll bind a chart to the “GSP” table in the GSP database (the gsp.mdb file is shipped with the installation of the XtraCharts Suite). This table contains the Gross State Product (GSP) statistics for certain US regions.
To bind a chart to data using series templates, do the following.
- Create Data Objects and Bind a ChartControl
- Specify a Series Data Member and Adjust a Series Template
- Populate with Data at Runtime (Optional)
- Customize the Chart
- Get the Result
Create Data Objects and Bind a ChartControl
- Start MS Visual Studio 2012, 2013, 2015, 2017 or 2019 and create a new Windows Forms Application or open an existing one.
Drop the ChartControl onto the form.
Note that after you drop the chart control, the Chart Wizard may be invoked (if its “Display a wizard every time a new chart is added” option is enabled). In this example, we don’t need to use the Wizard, so click Cancel to close its window.
- For the chart to occupy all the available space on the form, click the chart’s smart tag, and in its actions list, click Dock in Parent Container.
To create a data source for a chart, select it and click its smart tag. In the invoked actions list, expand the Choose Data Source drop-down selector and click the Add Project Data Source… link.
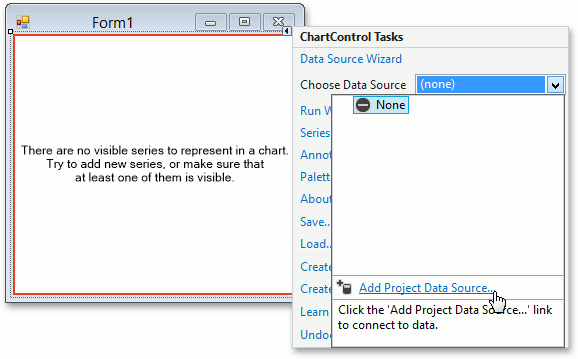
Then proceed through the following steps suggested by the invoked Data Source Configuration Wizard.
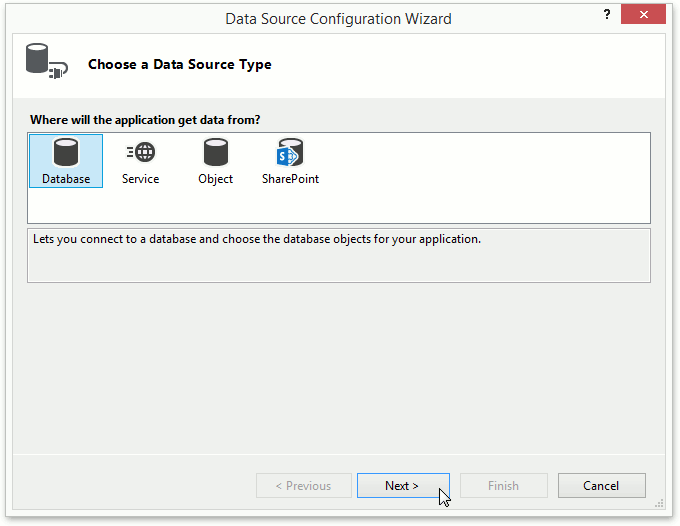
In the first step, leave the data source type as Database and click Next.
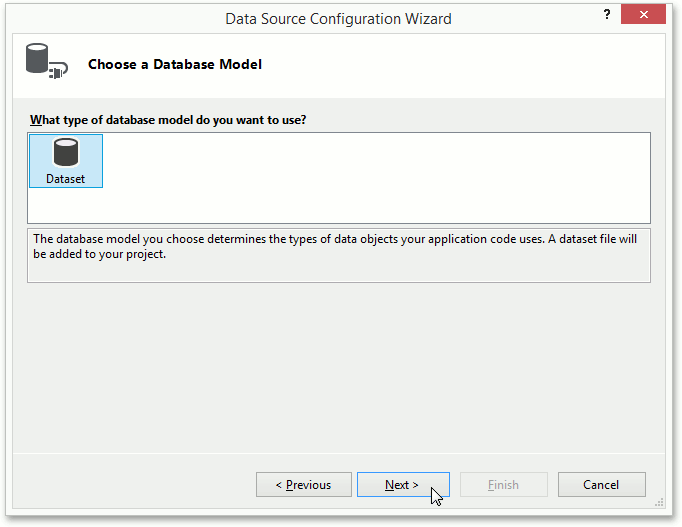
In the Choose a Database Model page, click Next.
On the following page, click New Connection….
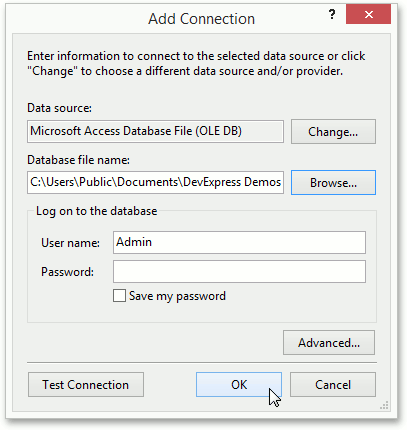
In the invoked Add Connection dialog:
- specify Microsoft Access Database File (OLE DB) as the database type in the Data source field. If necessary, use the Change… button to select between different types.
- In the Database file name field, specify the following path to the GSP database file - C:\Users\Public\Documents\DevExpress Demos 19.1\Components\Data\gsp.mdb (leave the Password option blank). You can use the Browse… button to locate this file.
Click OK to close the dialog.
Then click Next in the wizard.
The following message appears.
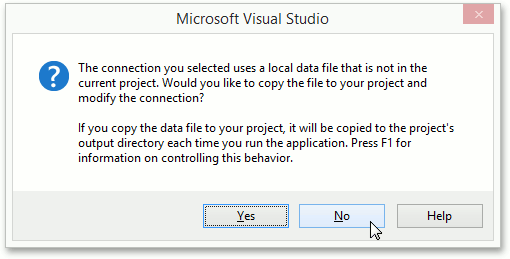
Note
You can choose between adding the file to your project or leaving it in its original location. For more information on Visual Studio behavior, see the “How to: Manage Local Data Files in Your Project” article in MSDN.
Select No, as this example is not intended to change database data.
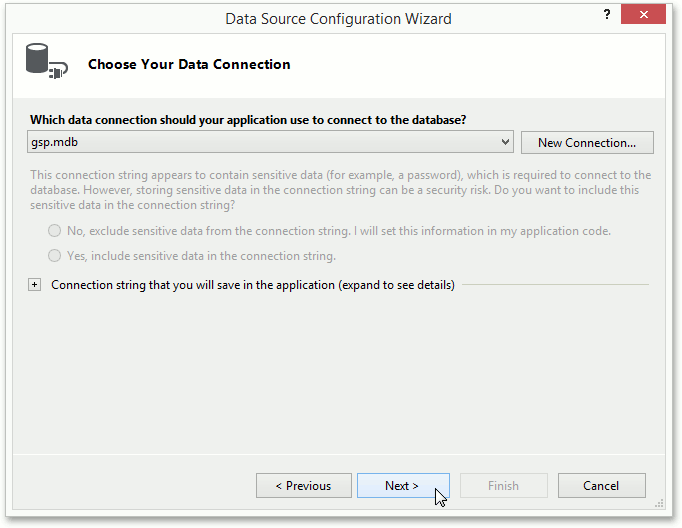
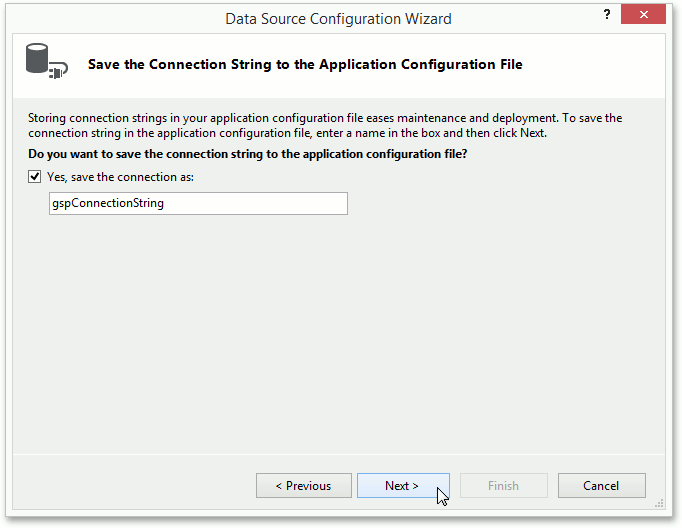
On the following page, you are asked whether or not the created connection string should be saved to the configuration file of your project.
Leave the default setting and click Next.
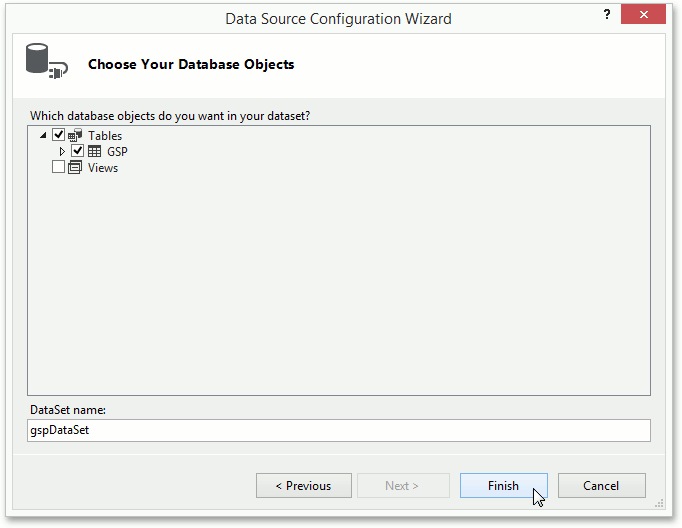
The final page allows you to choose tables, which should be obtained from the database.
Select the “GSP” table and click Finish.
After performing the above steps, Visual Studio generates a set of classes that support ADO.NET architecture, some of which are then auto-assigned to the appropriate properties of your chart control. In particular:
gspDataSet (a DataSet object that is a collection of possibly inter-related tables) containing the gspDataTable;
gSPBindingSource (a BindingSource component, which provides data in the chart’s dataset) is auto-assigned to the ChartControl.DataSource property;
gSPTableAdapter (TableAdapter object, which contains methods to get and post data from the specified table in the database) is auto-assigned to the ChartControl.DataAdapter property;
This means that the chart has been successfully bound to the data source. The next steps explain how to assign its data fields to the chart’s series template.
Specify a Series Data Member and Adjust a Series Template
Now, let’s specify a data field for as many series to be auto-created as there are records in this field. To do this, set the ChartControl.SeriesDataMember property to Year.
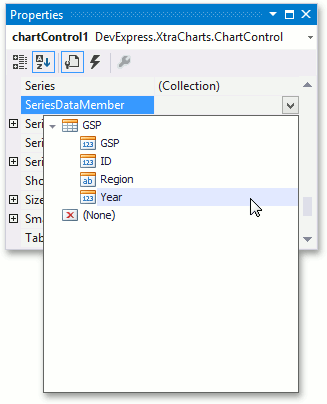
Note that series names (as they will appear in the Legend) will correspond to this field’s values.
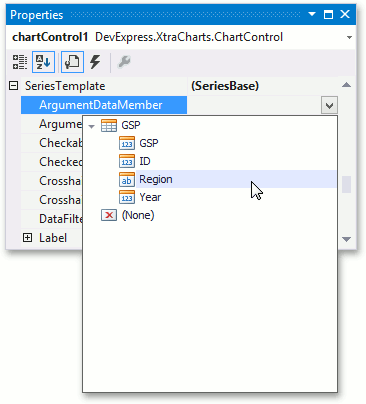
Now, adjust the series’ template, which is accessed via the chart’s ChartControl.SeriesTemplate property.
In particular, you are required to define data fields where series obtain information for their point arguments and values.
To accomplish this, set the SeriesBase.ArgumentDataMember property to Region.
Then set the only value of the SeriesBase.ValueDataMembers property to GSP.
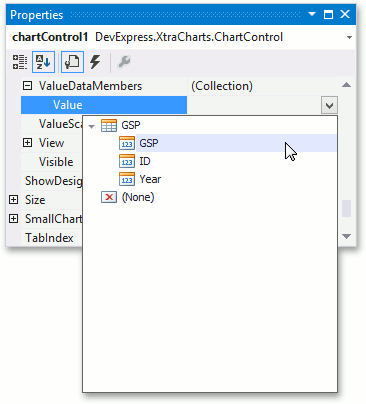
Note that some series view types may require more than one value for each argument (such as Stock or Bubble series). In such cases, multiple data members should be specified for the SeriesBase.ValueDataMembers collection.
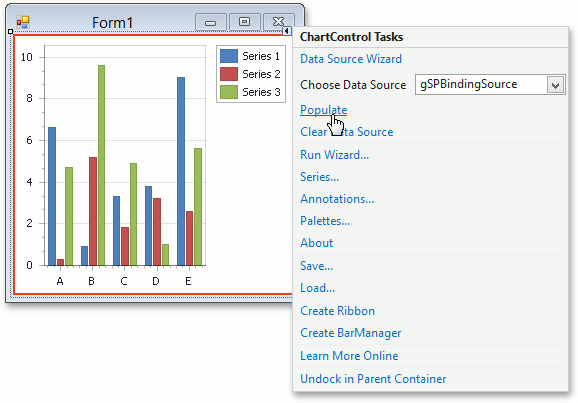
Now, the chart possesses complete information about the data source and its data members. However, it still doesn’t show the real data at design time. To populate your chart with genuine data, click the chart’s smart tag and click Populate.
Populate with Data at Runtime (Optional)
To populate a DataTable object with data from the database, the corresponding TableAdapter‘s Fill method can be used. In this example, the chart’s DataTable is populated with data using the Fill method of the gSPTableAdapter object. The form’s Load event is used to handle data loading.
private void Form1_Load(object sender, EventArgs e) { // TODO: This line of code loads data into the 'gspDataSet.GSP' table. // You can move or remove it as needed. this.gSPTableAdapter.Fill(this.gspDataSet.GSP); }Note
MS Visual Studio automatically adds the following code to the form’s Load event, and normally you don’t need to add it manually.
Customize the Chart
Finally, you can specify optional properties, which will be applied to all the auto-created series.
Adjust the series name template.
By default, the name for every auto-created series (as it appears in the Legend) is obtained from an appropriate data field. However, you may wish to add some prefixes or postfixes to these names, which can be done via the SeriesNameTemplate.BeginText and SeriesNameTemplate.EndText properties. For this instance, set the SeriesNameTemplate.BeginText property to “GSP in “.
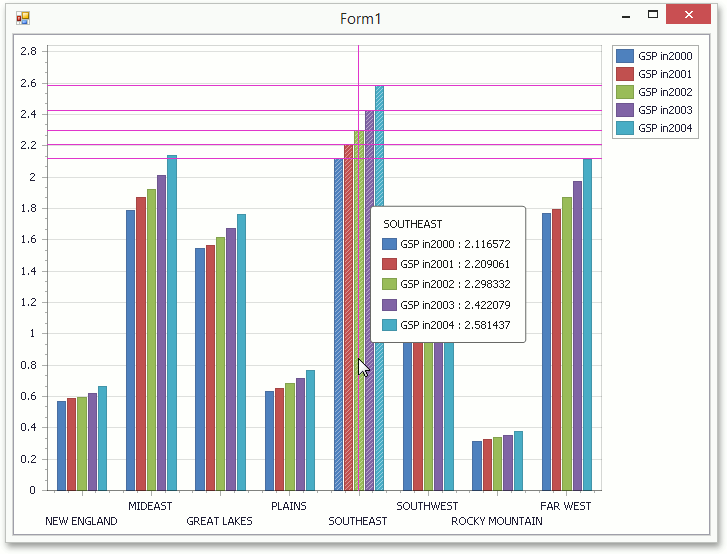
Adjust the crosshair cursor options.
By default, crosshair cursor labels and a crosshair argument line are displayed on a chart. You can disable (enable) a crosshair cursor both at the level of a chart via the ChartControl.CrosshairEnabled property and at the level of a chart series, using the SeriesBase.CrosshairEnabled property.
To show crosshair cursor value lines, set the CrosshairOptions.ShowValueLine property to true.
Get the Result
Run the project and view the result.