Axis
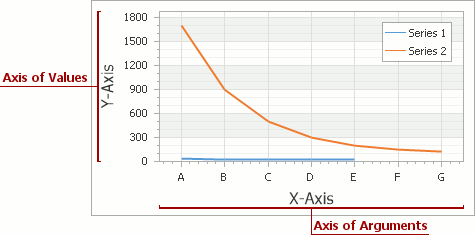
An Axis provides end-users with a visual means for reading and analyzing the data displayed within the diagram. Most charts contain two axes: a numerical axis of values (Y-axis) and an axis of arguments (X-axis). To review the concepts of a series point’s value and arguments, and the way in which axes are associated with series, refer to Charting Basics.
Along with the primary axes, you have the capability to associate your chart’s series with secondary axes, which are identical to the primary ones in most aspects. Both primary and secondary axes can be distributed among multiple panes, if required.
For more detailed information, refer to Axes.
An axis (be it primary or secondary) allows you to access and customize the following chart elements:
- Grid Lines, Tickmarks and Interlacing;
- Axis Titles;
- Axis Labels (both default and custom);
- Strips;
- Constant Lines;
- Scale Breaks.
The table below lists the main properties which affect the element’s appearance and functionality:
Class | The AxisBase class descendants |
Availability | The XYDiagram.AxisX or XYDiagram.AxisY property of a chart control’s diagram object. |
Appearance | Axis2D.Color, AxisBase.Interlaced, AxisBase.InterlacedColor, Axis2D.InterlacedFillStyle, Axis2D.Thickness |
Layout | |
Visibility |