How to: Add an Unbound Field to Change Axis Detailing
- 2 minutes to read
This example demonstrates how to implement custom group intervals.
The image below shows a sample report which displays the average salary and seniority of employees. Employees are grouped by their age and department.
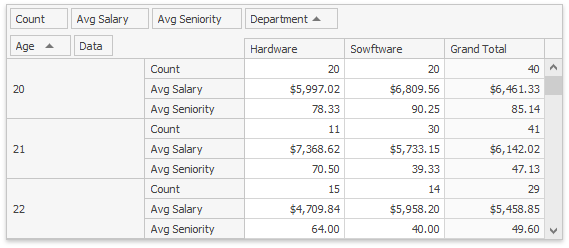
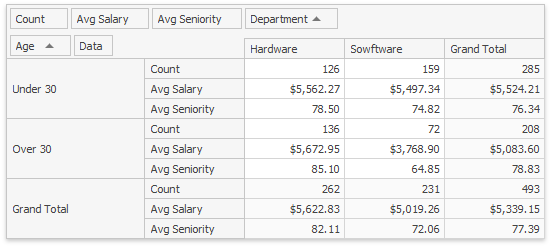
To compact the report further and make it more readable, the values in the Age axis are grouped. This axis shows two intervals (“Under 30” and “Over 30”) instead of displaying individual age values.
Perform the steps below to group values using an unbound field.
- Create an unbound field and set the PivotGridFieldBase.UnboundType property value to Integer. (see Unbound Fields for more details).
- Handle the PivotGridControl.CustomUnboundFieldData event to supply group values to the unbound field.
- Handle the PivotGridControl.FieldValueDisplayText event to substitute group values with the user-friendly text.
The image below shows the result:
private void pivotGridControl1_CustomUnboundFieldData(object sender, DevExpress.XtraPivotGrid.CustomFieldDataEventArgs e) {
   if(e.Field != fieldAgeRange) return;
   if(Convert.ToInt32(e.GetListSourceColumnValue("Age")) > 30) e.Value = 1;
   else e.Value = 0;
}
private void pivotGridControl1_FieldValueDisplayText(object sender, DevExpress.XtraPivotGrid.PivotFieldDisplayTextEventArgs e) {
   if(e.Field == null) return;
   if(e.Field != fieldAgeRange) return;
   e.DisplayText = ((int)e.Value == 1) ? "Over 30" : "Under 30";
}