Grouping
- 4 minutes to read
Grouping allows you to automatically group specific field values into bigger categories (ranges). For example, values of a column/row field, which displays date/time data can be grouped by years, months, quarters, etc. Unique numeric values can be grouped into numeric ranges. String values can be grouped by the starting characters of the values.
Tip
Demo:
Grouping Overview
In the following image you can see two Pivot Grid controls. The first control displays the original data before it is grouped, and the second Pivot Grid control groups values of the Order Date column field by months.
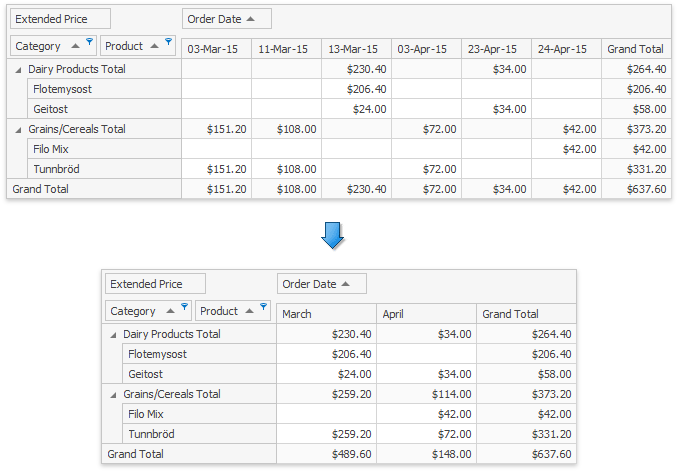
Each column in the second Pivot Grid groups values of appropriate columns in the first Pivot Grid. For instance, the 03-Mar-15, 11-Mar-15 and 13-Mar-15 columns are grouped into the March column from the first Pivot Grid.
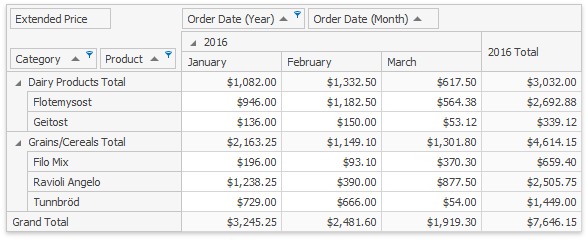
You can bind the Pivot Grid fields to the same field in an underlying data source and group the values of these fields independently. For example, you can combine date/time data by years, months, quarters and so on. The image below shows the Pivot Grid where the first Order Date field is grouped by years and the second field values - by months.
Predefined Grouping Intervals
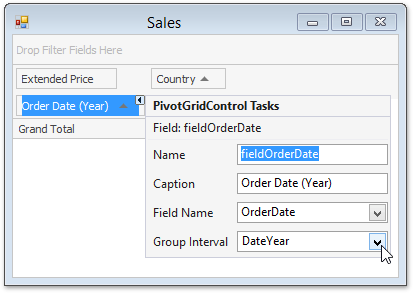
To combine values of the current column or row field into groups, you need to specify a group interval. The image below shows the OrderDate field that stores date/time values. These values are grouped into DateYear interval using the Pivot Grid field’s smart tag menu.
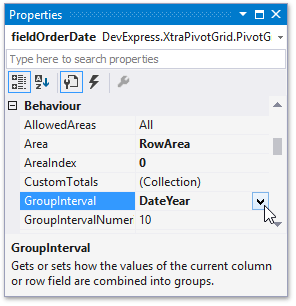
Group intervals can also be accessed from the Properties grid by clicking the drop-down button for the PivotGridFieldBase.GroupInterval property.
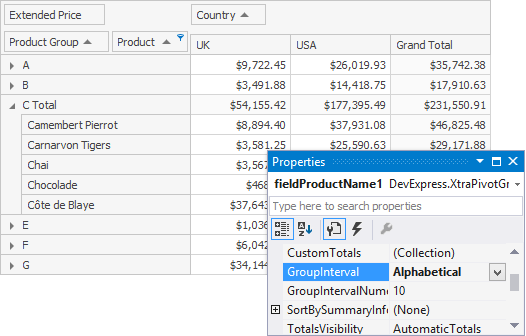
String values can be also combined into groups. For this, set the PivotGridFieldBase.GroupInterval property to Alphabetical. This allows you to group field values into categories according to the character that the values start with.
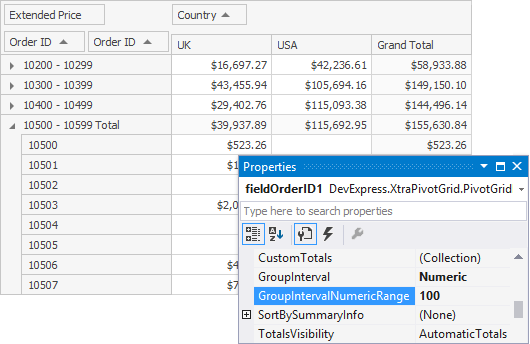
For numeric values, you can specify the length of the intervals by using the PivotGridFieldBase.GroupIntervalNumericRange property. This property is in effect for the following group intervals: Numeric, YearAge, MonthAge, WeekAge and DayAge. For instance, if the PivotGridFieldBase.GroupIntervalNumericRange property is set to 100, the values will be combined into the following intervals: 0-100, 101-200, 201-300, and so on. The image below shows the Pivot Grid with two Order ID fields. The values of the first field are arranged into groups of 100 orders.
Custom Grouping Intervals
If the standard grouping modes do not suit your requirements, you can implement custom grouping intervals using the event or unbound fields.
Custom Grouping using an Event
The PivotGridControl.CustomGroupInterval event allows you to implement a complex grouping algorithm. To handle this event, set the PivotGridFieldBase.GroupInterval property to Custom.
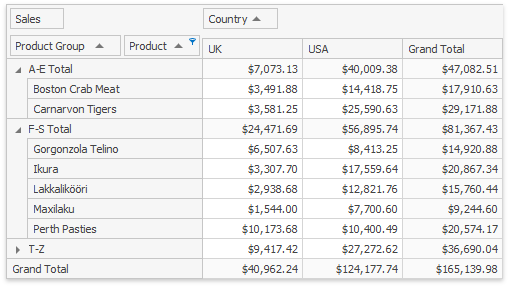
The image below demonstrates the Pivot Grid control that contains two row fields bound to the same ProductName data source field named Product Group and Product respectively. The custom grouping is applied to the first field and combines the first field’s values by the starting characters of values into three large ranges: A-E, F-S, and T-Z.
Custom Grouping using Unbound Fields
The unbound (calculated) fields allow you to implement custom grouping as well. These fields do not fetch data directly from the data source. Instead, you must specify how Pivot Grid calculates their values.
Perform the steps below to group values using an unbound field.
- Create an unbound field (see Unbound Fields for more details).
- Handle the PivotGridControl.CustomUnboundFieldData event to supply group values to the unbound field.
- Handle the PivotGridControl.FieldValueDisplayText event to substitute group values with user-friendly text.
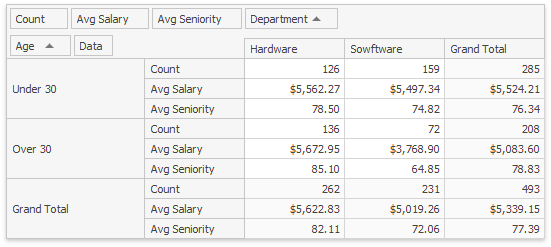
The image below illustrates a sample report that displays the average salary and seniority of employees. Employees are grouped by their age and department. To compact the report and make it more readable, the values of the Age field are grouped. This field shows two intervals (“Under 30” and “Over 30”) rather than display each unique age.
Examples
- How to Group Date-Time Values
- How to Implement Custom Group Intervals using the Event
- How to Implement Custom Group Intervals using Unbound Fields