How to: Display the Chart Title
- 2 minutes to read
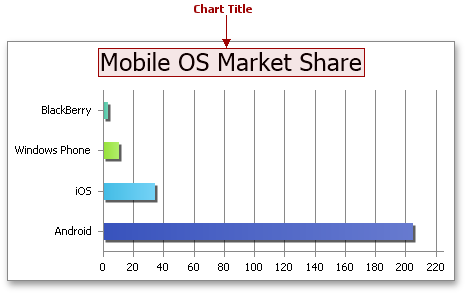
After you create a chart, you can display its title (a text header that explains a chart’s purpose). The chart title is always displayed at the top of the chart.
To add the chart title, utilize the ChartObject.Title property, which provides access to the ChartTitle object. This object defines the main chart title and inherits basic title settings from the ChartTitleOptions and ChartText interfaces, which contain members used to display the title and specify its contents. Set the ChartTitleOptions.Visible property to true to add the title, and then do one of the following.
- To specify the title text manually, use the ChartText.SetValue method.
- To extract the text for the title from the cell range, use the ChartText.SetReference method.
You can also format the chart title by changing its font attributes. For information on how to change the format options of chart elements, refer to the How to: Format Chart Elements example.
Note
A complete sample project is available at https://github.com/DevExpress-Examples/winforms-spreadsheet-chart-api-e5222
Worksheet worksheet = workbook.Worksheets["chartTask2"];
workbook.Worksheets.ActiveWorksheet = worksheet;

// Create a chart and specify its location.
Chart chart = worksheet.Charts.Add(ChartType.BarClustered, worksheet["B4:C7"]);
chart.TopLeftCell = worksheet.Cells["E3"];
chart.BottomRightCell = worksheet.Cells["K14"];

// Display the chart title and specify the title text.
chart.Title.Visible = true;
chart.Title.SetValue("Market share Q3'13");

// Hide the chart legend.
chart.Legend.Visible = false;
// Specify that each data point in the series has a different color.
chart.Views[0].VaryColors = true;