Colorizers
- 4 minutes to read
This document introduces the Map Colorizer, lists colorizer types, and explains how to create a colorizer and customize its settings.
The document consists of the following sections.
Overview
The Colorizer is used to automatically choose colors for map shapes based on shape data. This feature can be applied to the following MapShape class descendants that utilize the MapItem.Fill property:
For example, you can use the map colorizer to create GDP, population or political maps.
Before using this feature, you will need to perform the following steps.
1) Specify how the vector items layer will obtain the map shapes to color.
This can be done in two ways:
- Create a MapItemStorage, add the shapes to the storage manually, and set the VectorItemsLayer.Data property value to the storage.
- Use the datasource or the Load Vector Items from Vector Format Source (a KML file or Shapefile) from which the map shapes are obtained.
For instance, to specify a path to the Shapefile at design time, do the following:
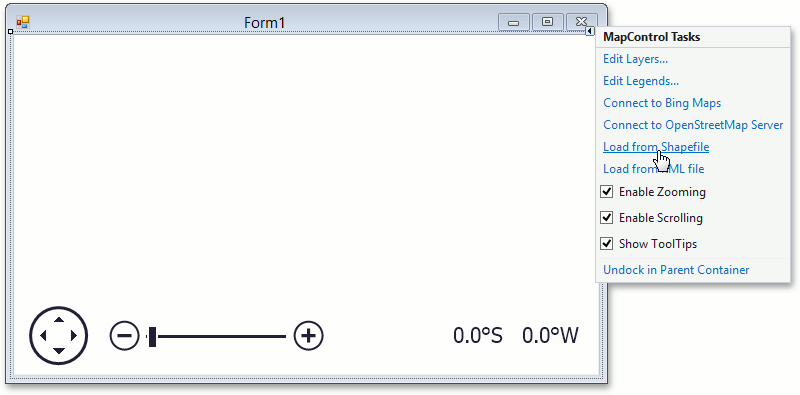
Click the smart tag of the Map control to invoke its actions list. In the invoked actions list, click the Load from Shapefile link.
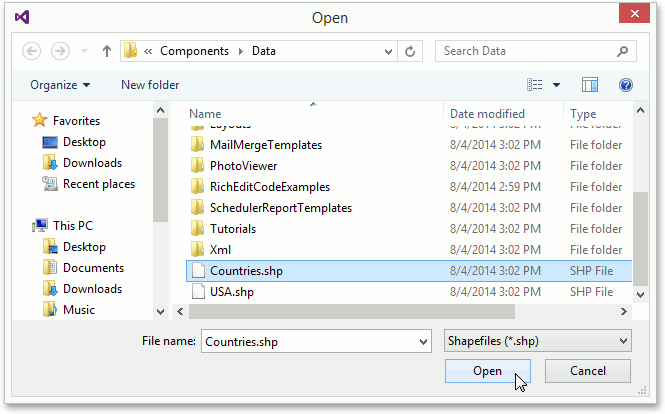
In the invoked dialog, specify a path to the Shapefile.
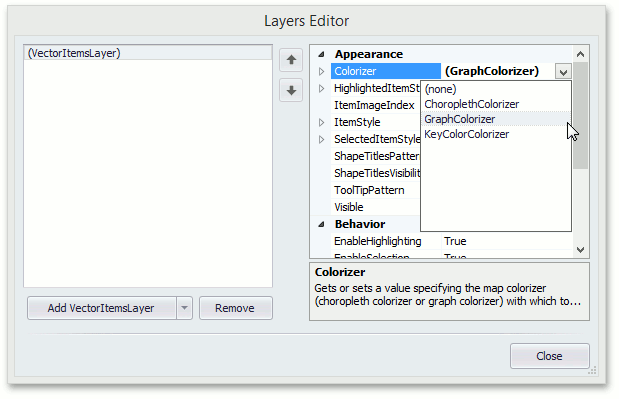
2) Choose which colorizer type should be used in your application.
Currently, the following colorizer types are supported:
-
Represents the Choropleth colorizer, which shows statistical data over predefined regions (such as counties or states) by coloring or shading these regions.
-
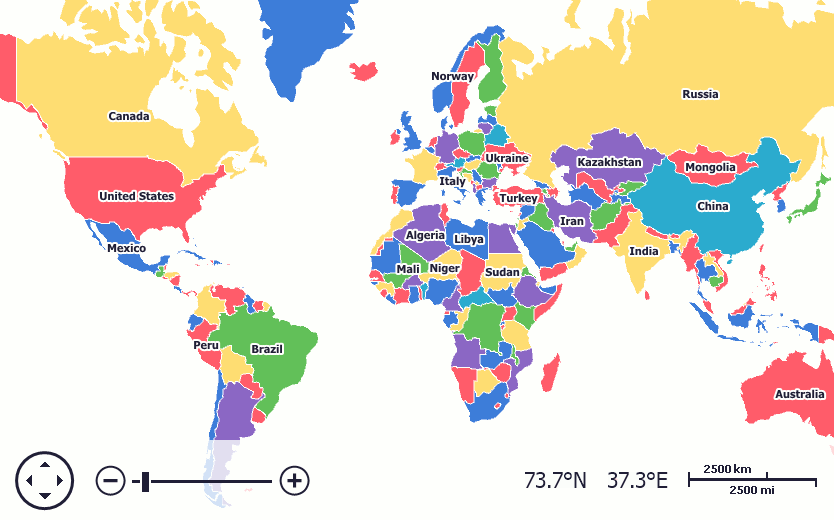
Represents the Graph colorizer, which paints shapes that have a common border using different colors according to the Graph Coloring approach. For instance, the Graph colorizer can be used to create a political map.
-
Represents the Key-Color colorizer, which paints shapes according to their keys. The Key-Color colorizer can be used to add statistical information to a map.
Note
Shapes that have been obtained from a KML file can only be colored by the Graph Colorizer.
To add the colorizer to the map control, it is necessary to create one of the MapColorizer class descendants and assign it to the VectorItemsLayer.Colorizer property of the appropriate vector layer.
After you select a colorizer type, you can customize the map colorizer settings. The sections below describe how this can be done.
Choropleth Colorizer
To customize the Choropleth colorizer, perform the following steps:
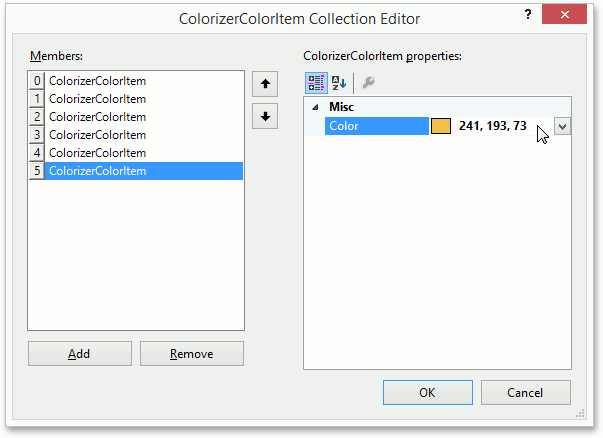
- Specify the desired set of colors in the GenericColorizerItemCollection<T> object, which is accessed using the ChoroplethColorizer.ColorItems property.
Specify range stops (data splits in ranges) for the colorizer using the ChoroplethColorizer.RangeStops property.
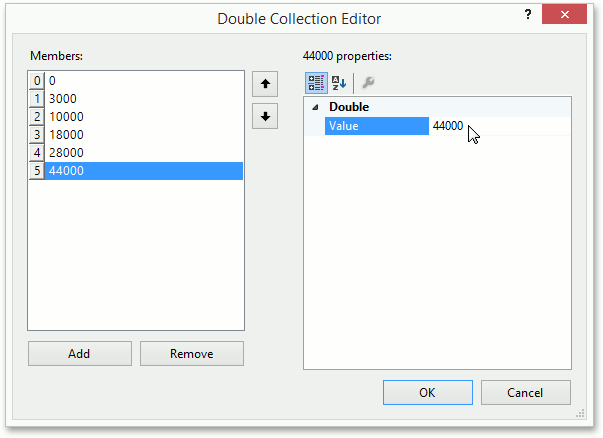
The colorizer automatically associates each color with the specified data range to colorize map shapes.
If you specify more ranges than colors, the colorizer, after reaching the last color in the collection, will reuse colors starting from the beginning of the collection.
- Choose the value range distribution type you would like to use in the choropleth colorizer. The colorizer supports three types: ExponentialRangeDistribution, LinearRangeDistribution and LogarithmicRangeDistribution. To apply one of the range distribution types, use the ChoroplethColorizer.RangeDistribution property. The linear range distribution is used by default.
To access information associated with a shape, specify the desired vector items attribute. To do this, create a ShapeAttributeValueProvider object, set its attribute name (ShapeAttributeValueProvider.AttributeName) and assign it to the ChoroplethColorizer.ValueProvider property.
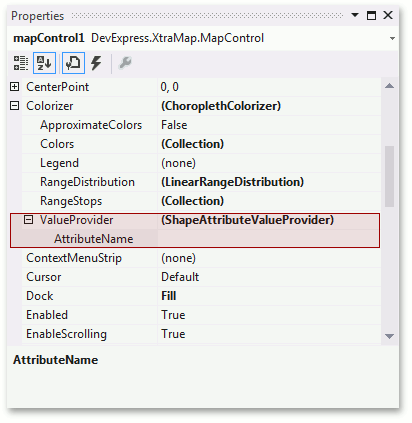
Note that when the map control obtains data from a Shapefile, the vector item attributes are generated automatically. Thus, you can select which attribute should be used in your application.
The image below shows the choropleth colorizer with a color scale legend that colors map contours based on GDP data from the Shapefile.
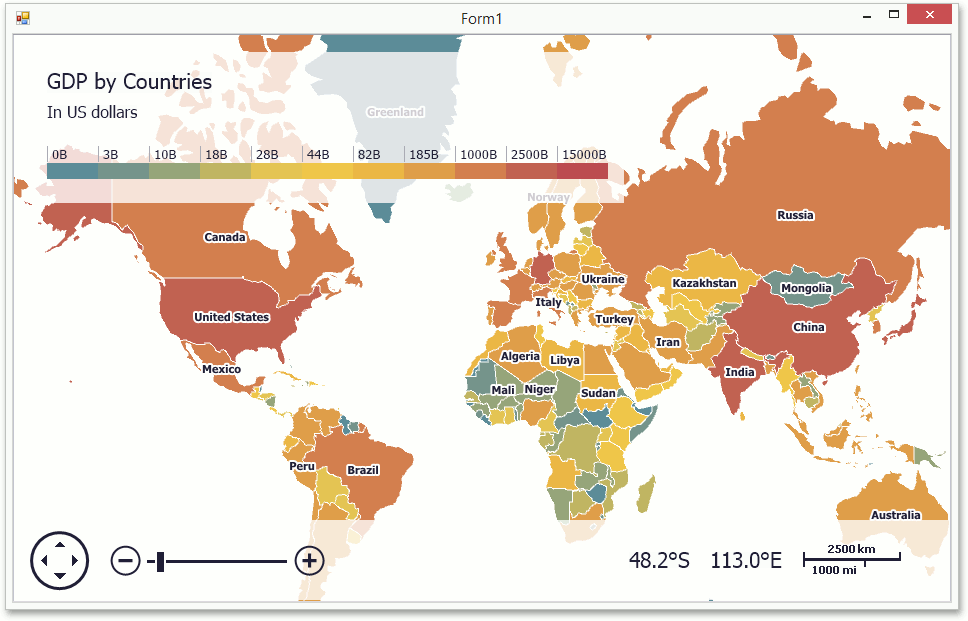
To learn more about how to colorize map contours from a Shapefile, refer to How to: Colorize Map Contours Using the Choropleth Colorizer.
Graph Colorizer
To colorize map contours, specify a set of color items using the GraphColorizer.ColorItems property.
As a result, the map contours appear as follows.
This example shows how to use the graph colorizer at run time: How to: Colorize Map Contours Using the Graph Colorizer.
Key-Color Colorizer
To colorize Map shapes using key-color colorizer, do the following.
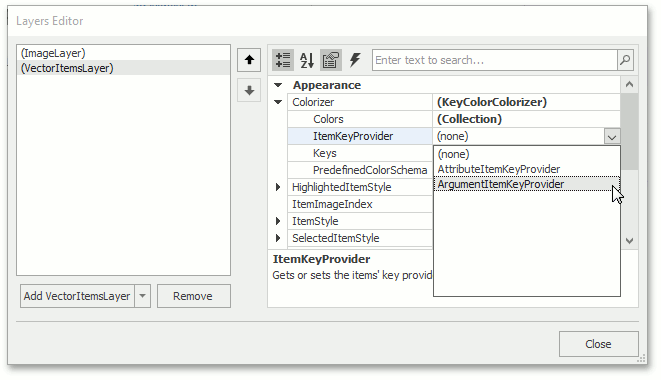
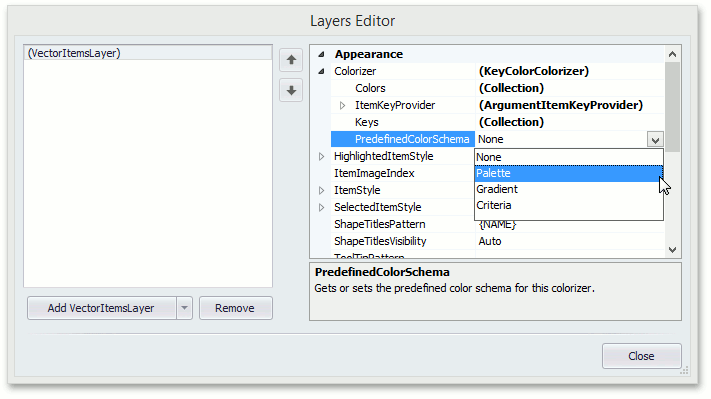
Specify the KeyColorColorizer.ItemKeyProvider property.
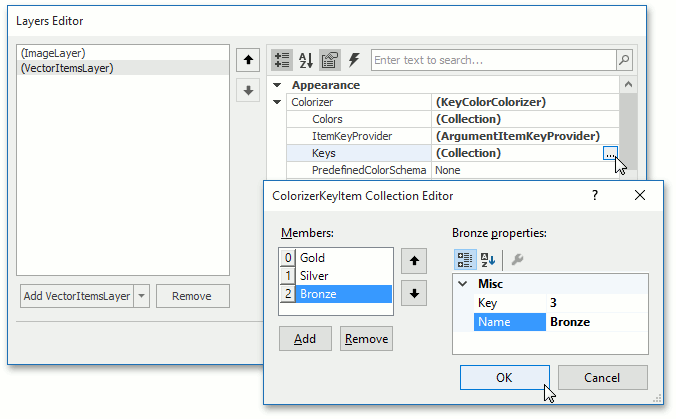
Create a few ColorizerKeyItem objects representing keys which will be used to select a color, and add them to the colorizer with KeyColorColorizer.Keys. Note, that a key collection may be generated automatically.
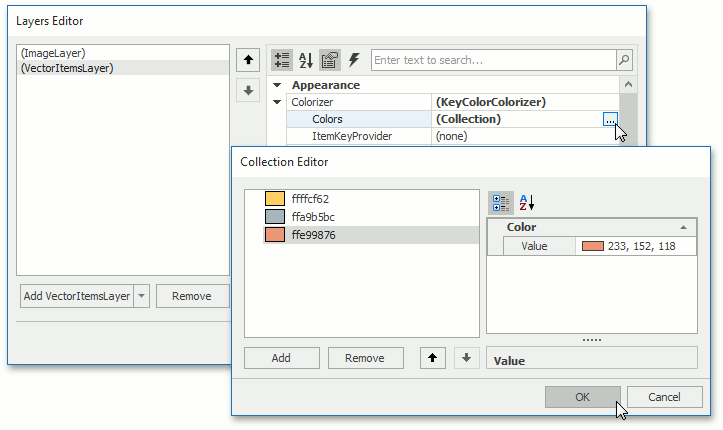
Add several Color objects to the KeyColorColorizer.Colors collection.
Or use a predefined color collection, specifying the PredefinedColorsColorizer.PredefinedColorSchema property.
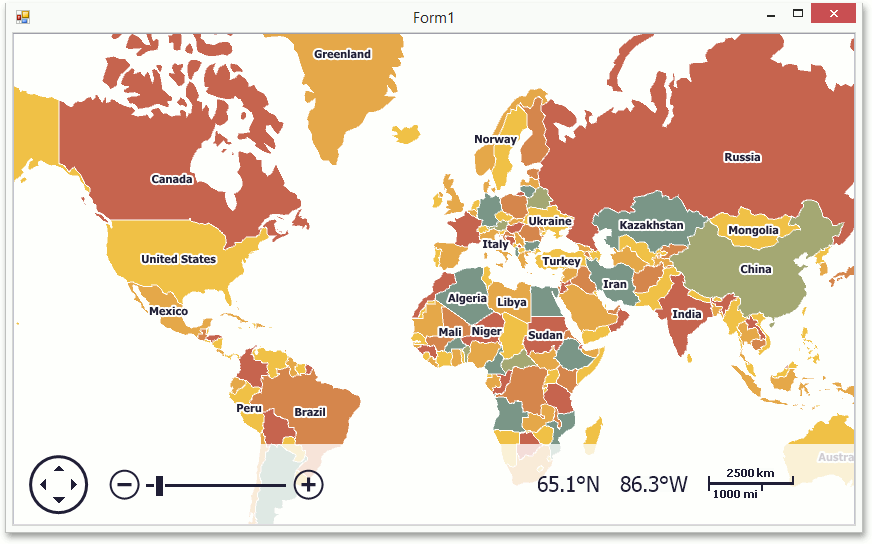
As a result, the map shapes appear as follows.
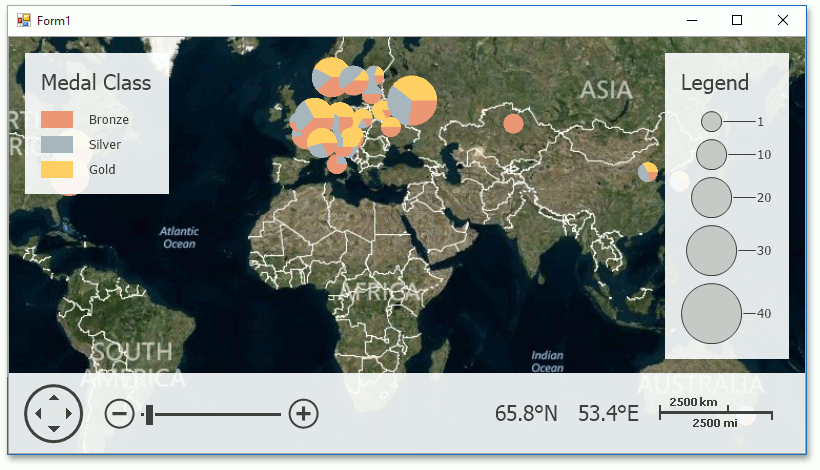
To learn more about how to colorize map items using key-color colorizer, refer to How to: Colorize Map Items Using the Key Color Colorizer.