Data Explorer
- 3 minutes to read
This topic describes how to use the Data Explorer in Snap.
This topic consists of the following sections.
Overview
The Data Explorer is an instance of the FieldListDockPanel class.
The Data Explorer is essential for managing data in Snap applications. It allows you to add new data sources to a Snap document, assess their structure and run the Query Designer to customize a data source.
Note
Only one data source at a time can be used in a mail merge operation. Snap does not join independent data sources automatically, so there are only two distinct scenarios available - merging all records from a single data source and a master-detail scenario. You are advised to combine data from different data sources and subsequently supply a joined data source to Snap.
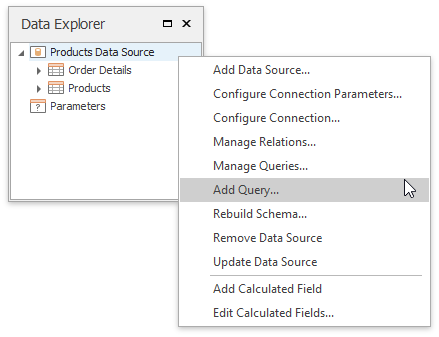
Using the Data Explorer, you can also manage a report’s parameters, as well as the calculated fields supplied to the data source tables.
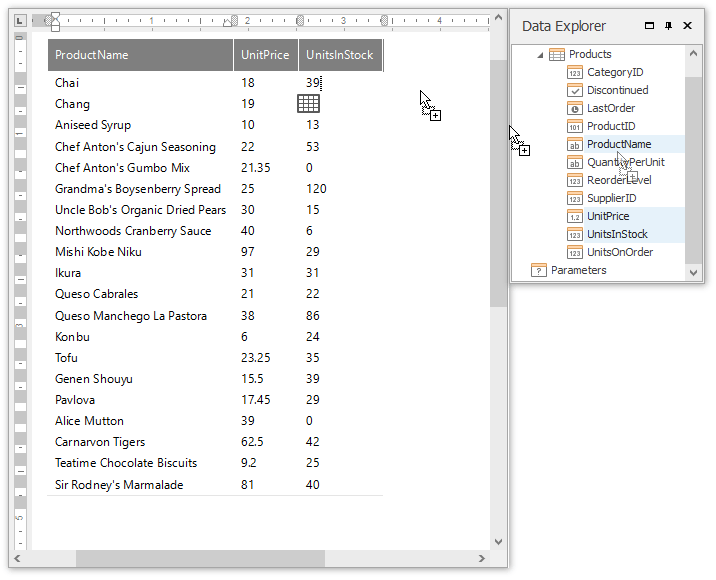
You can create a Snap report layout by dropping the data members from the Data Explorer onto a document’s design surface. The data members correspond to the columns created on the design surface, and the data member names are displayed in the column headers.
To display data in a chart, drop data fields from the Data Explorer onto the corresponding chart areas.
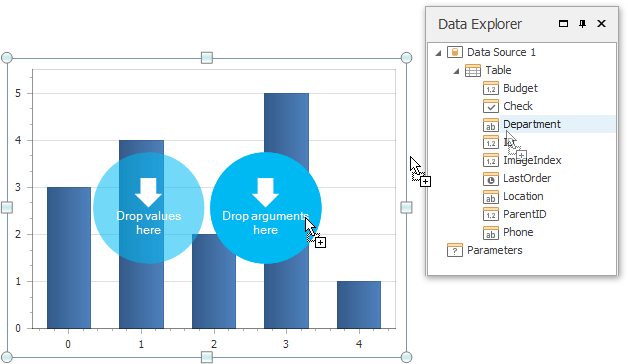
When a data field is added to your document, its data type determines what element is created (e.g., text, chart, or bar code).
Data Type Reference
In the Data Explorer, different icons are assigned to various data objects. These icons are explained in the following table.
Icon | Description |
|---|---|
(regular data source)
(mail merge data source) | Designates an individual data source. When expanded, shows the hierarchy of its tables and/or views. |
(regular data source)
(mail merge data source) | Designates a data table or view within a data source. When expanded, shows the hierarchy of its data fields. You can drag a data table and drop it onto the document surface, after which the entire table structure will be presented in the report in a tabular form. |
| Parameters. Lists the report parameters. You can include parameters in a document’s filtering expression or calculated fields, or you can use them directly in your reports, (e.g., by dropping them onto the document surface). |
For every table or view, the Data Explorer lists the available data fields. Depending on the data type, it will automatically assign one of the following icons.
Icon | Data Type | Displayed Contents |
|---|---|---|
(regular data source)
(mail merge data source) | Boolean | Check Box, plain text |
(regular data source)
(mail merge data source) | Byte | Bar Code, Picture |
(regular data source)
(mail merge data source) | Date-time | Plain text |
(regular data source)
(mail merge data source) | Numeric | Plain text, Bar Code |
(regular data source)
(mail merge data source) | String | Plain text, Bar Code |
| Depends on the result of the calculation. |