How to: Create Sparklines
- 3 minutes to read
All sparklines in a worksheet are organized in groups. Each group can contain one or more sparklines of the same type that share identical formatting settings and axis scaling options. To create a new group of sparklines, get access to the worksheet’s SparklineGroupCollection collection using the Worksheet.SparklineGroups property, and then call the SparklineGroupCollection.Add method. Pass the following parameters.
- A Range object that specifies a range of cells where the sparkline group should be located. You can either use a continuous one dimensional range, or specify each cell individually by inserting commas between two or more cell references within the Worksheet.Range property.
- A Range object that specifies the data source for the sparkline group. To add multiple sparklines at once, refer to multiple ranges within the Worksheet.Range property by inserting commas between two or more references, or use the IRangeProvider.Union method to combine multiple ranges into one complex range. Note that a data range for a single sparkline should be a continuous one-dimensional cell range (all cells of which are located in a single row or column). Also, the number of distinct ranges must be equal to the number of cells in the location range (defined by the SparklineGroup.Position property). If the specified cell range is insufficient for a sparkline group, an exception is thrown.
A SparklineGroupType enumeration value that specifies the sparkline group type. The table below lists the available types of sparkline groups.
Sparkline Type
Enumeration Value
Description
Example
Line
Connects sparkline data points with a line.

Column
Creates a series of columns, whose lengths are proportional to the data values they represent.

Win/Loss
Creates a series of squares, each of which can occupy one of the following positions:
if the data value is positive, the square is displayed at the top of the cell (win);
if the value is negative, the square is displayed at the bottom of the cell (loss).

To add a new sparkline to the existing group, access the collection of all sparklines contained in this group by using the SparklineGroup.Sparklines property, and call the SparklineCollection.Add method. This method allows you to define a cell at the intersection of the specified row and column where the new sparkline should be located and the cell range containing the source data for this sparkline.
// Create a group of line sparklines.
SparklineGroup quarterlyGroup = worksheet.SparklineGroups.Add(worksheet["G4:G6"], worksheet["C4:F4,C5:F5,C6:F6"], SparklineGroupType.Line);
// Add one more sparkline to the existing group.
quarterlyGroup.Sparklines.Add(6, 6, worksheet["C7:F7"]);

// Display a column sparkline in the total cell.
SparklineGroup totalGroup = worksheet.SparklineGroups.Add(worksheet["G8"], worksheet["C8:F8"], SparklineGroupType.Column);
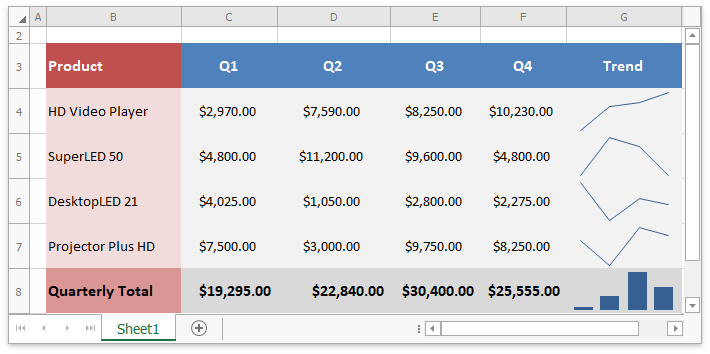
The image below shows the result.