The WinForms Spreadsheet emulates the Microsoft® Excel® look and feel and allows you to create, load, edit, save and print spreadsheet documents.
The Spreadsheet Control stores data in a grid of cells organized in rows and columns, and provides comprehensive data shaping and analysis tools, such as data mining, grouping, filtering, and charting. The built-in formula calculation engine allows you to create simple formulas to summarize your information or construct complex formulas containing mathematical, statistical, financial and other predefined functions for advanced data analysis.
Before you start working with your data in the spreadsheet application, you must load the required data to the control. There are several ways to achieve this task: you can create a new document and populate it with data, load an existing file of the spreadsheet format (XLS, XLSX, XLSM, XLTX, XLTM, XLT, TXT, or CSV) or retrieve data from different data sources (such as arrays, lists and data tables). Subsequently, you can save modified data to a file in supported formats, convert your document into a PDF file or web page, or export data from a worksheet to a DataTable.
To get started with the Spreadsheet Control and create your first spreadsheet application in Visual Studio, follow the Getting Started tutorial. Look through the Examples section to learn how to accomplish different tasks using the Spreadsheet API.
A workbook represents a spreadsheet document. By default, when you launch the spreadsheet application, it creates an empty workbook you can populate with data. You can also load the existing workbook and modify it. After you finish working with your workbook, you can save it in a variety of file formats or print it if required.
A worksheet is a single page within a workbook. A worksheet is used to store and manipulate data in the Spreadsheet Control. By default, the Spreadsheet contains only one worksheet with the default name. You can add new worksheets to a workbook, rename worksheets, move or copy worksheets, hide worksheets, or delete them if they are no longer needed.
All worksheet data is stored in cells. Each cell can hold different types of cell values: numbers, text, logical values, or formulas. You can access an individual cell and set its value, modify, copy or delete the existing cells. The Spreadsheet Control also allows you to apply formatting to a cell to change the way a cell value is displayed.
Worksheet cells are organized into 1,048,576 rows and 16,384 columns. The Spreadsheet Control provides many capabilities allowing you to manage rows and columns in a worksheet. You can insert, copy or remove them, specify row height and column width, control row and column visibility, freeze rows and columns, hide or display row and column headers, etc.
Using the Spreadsheet Control, you can view and modify documents containing drawing objects such as shapes, pictures and charts. You can adjust the position of embedded objects by moving, resizing and rotating them.
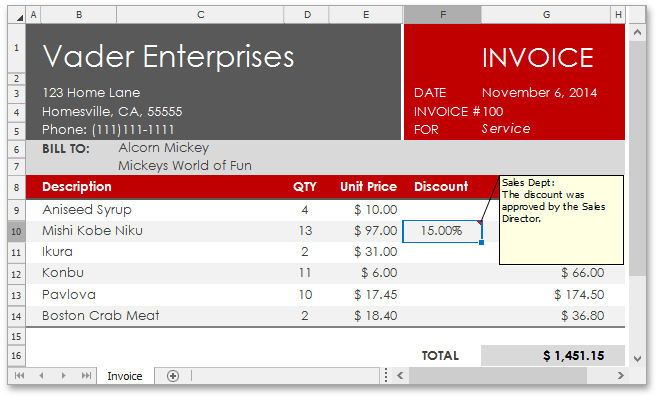
The Spreadsheet Control allows you to attach additional information to worksheet cells by using comments. You can add a new comment, edit the content of the existing comment, copy comments, move and resize the comment box, hide or delete unnecessary comments.
Cell Editing
Within the Spreadsheet Control, end-users can add data to worksheet cells in the same way as it can be done in Microsoft® Excel®. To edit a cell value, end-users can double-click the required cell to activate the cell’s in-place editor, press F2, or just start typing. They can enter a numeric or text value, or calculate the cell value dynamically by inserting a formula.
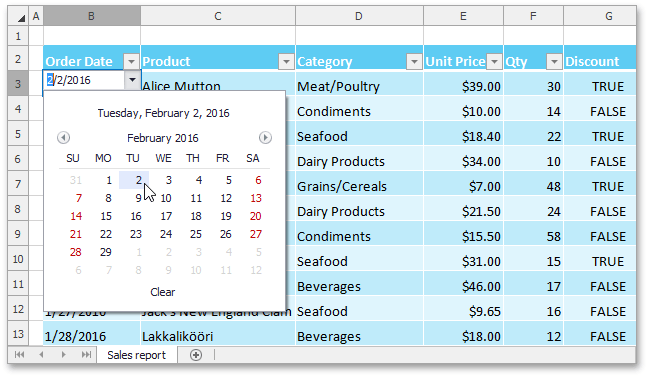
You can also facilitate and validate user input by using custom editors for in-place editing of cell content. You can select one of the predefined in-place editors for cells (DateEdit, ComboBoxEdit, or CheckEdit) or handle the SpreadsheetControl.CustomCellEdit event to assign your own custom editor to the required cells. For details, refer to the Custom Cell In-place Editors example.
Cell References and Defined Names
A cell reference points to a cell or cell range within the same or different worksheet, and can be used in formulas to perform calculations.
The Spreadsheet Control supports the following types of cell references.
A1 and R1C1 References
Cross-Worksheet References
3D References
External References
Structured References
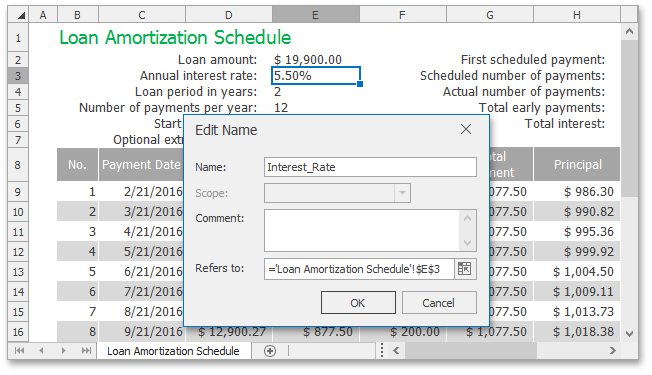
You can also define descriptive names for cell references to make it easier to understand the information contained in cells and formulas. For end-users, the Spreadsheet Control provides the Name Manager dialog that allows them to create, delete or edit existing defined names.
The Spreadsheet Control ships with the Name Box control, which displays a reference to an active cell or a name for the selected range (if specified), picture or chart.
Formulas and Functions
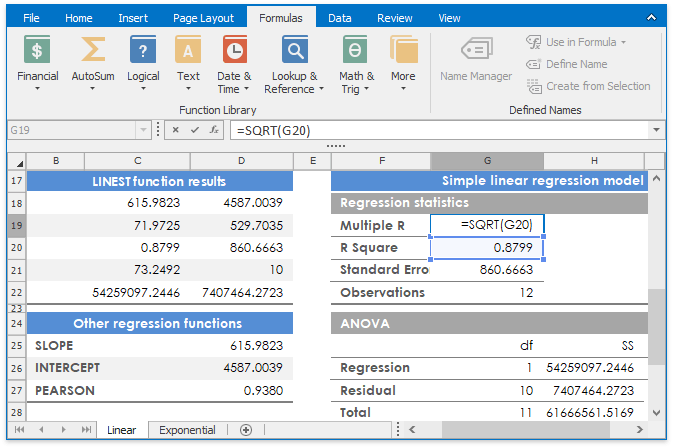
Perform simple or complex calculations on cell values using spreadsheet formulas. Each formula represents a string expression that starts with an equal sign and may include the following elements: constants, operators, cell references, defined names, and predefined functions.
The Spreadsheet Control supports a wide range of built-in functions divided into categories by their functionality (mathematical, statistical, financial, logical, lookup and reference functions, etc.). In addition, you can create your own custom function for use in formulas.
The Spreadsheet Control offers many options allowing you to control the calculation process. For example, enable the automatic calculation mode to recalculate formulas in a workbook every time cell values they depend on are changed, or switch to the manual mode to calculate formulas only when you explicitly request it. You can also access the spreadsheet Formula Engine to get the opportunity to calculate and parse worksheet formulas. You can parse a formula into an expression tree, modify it and then rebuild the string expression.
For end-users, the Spreadsheet Control provides the formula editing tool similar to that in MS Excel - Formula Bar. Add it to the control to enable your users to enter and edit formulas in the Formula Bar, not just in the cell’s in-place editor. The Formula Bar assists end-users with building formulas. In particular, it allows them to invoke the Insert Function and Function Arguments dialogs to insert a function into a formula and specify its arguments.
The Spreasheet Control enables you to change the appearance of a cell or cell range in a single step by applying a cell style - a named set of predefined cell format characteristics. You can choose from a wide range of built-in cell styles similar to Microsoft® Excel® or create your own custom style.
Apply different format attributes to individual cells and cell ranges: color the cell background, adjust font settings, align cell content, add borders and specify number format options.
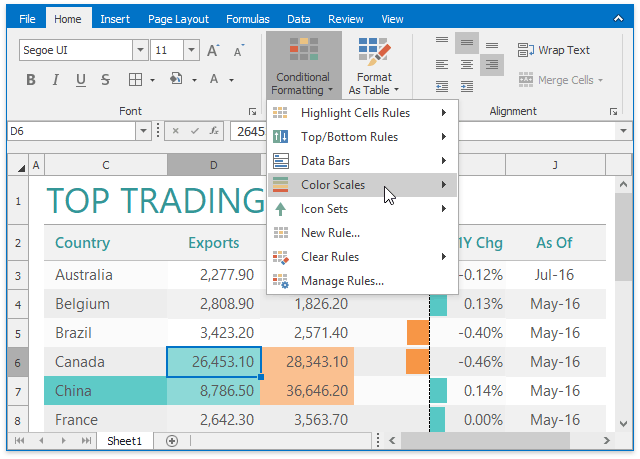
Change the appearance of individual cells based on conditional formatting criteria. Conditional formatting help you explore data in a worksheet by highlighting cells with specific values, or describe trends within cells by using data bars, color scales and icon sets.
The Spreadsheet Control allows you to perform custom painting of worksheet cells, row and column headers by using the CustomDraw* events. Use the custom draw functionality to customize the document appearance and paint text, graphic primitives or images.
Data Binding
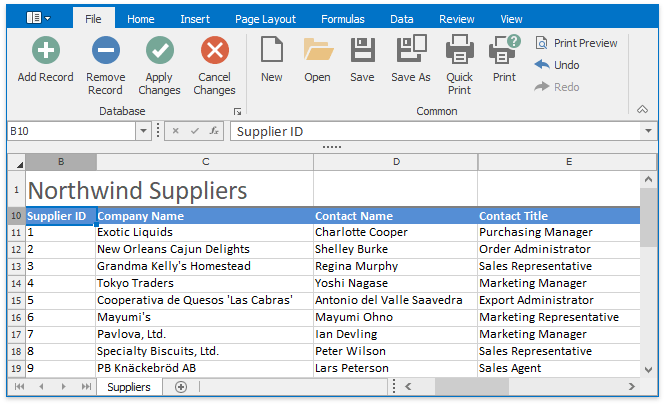
The data binding functionality of the Spreadsheet Control enables you to retrieve data from various data sources (such as ADO.NET data sets, SQL databases, XML files, lists of custom objects, etc.) and display it in a worksheet, so that you can further analyze or modify it. Data binding works both ways: for reading and updating data.
A cell range can also be used as a data source for any data-aware control. All data-related modifications affecting the worksheet are immediately propagated to bound controls and changes made within external controls are immediately reflected in the worksheet.
The Spreadsheet Control allows you to convert a regular range of cells in a worksheet into a table. Using tables, you can manage your data more effectively: sort and filter table data with ease, use table names in formulas (structured references), create a calculated column, total data in the table by displaying the total row, etc. You can also adjust the appearance of the created table by applying a built-in or custom table style.
The Spreadsheet Control implements the filter functionality with which you can easily arrange large amounts of data in a worksheet by displaying only rows that match the filtering criterion. Different types of filters are available: Text Filters, Number Filters, Date Filters and Filter by Values. When filtering, you can use the built-in comparison operators, or create your own custom criteria.
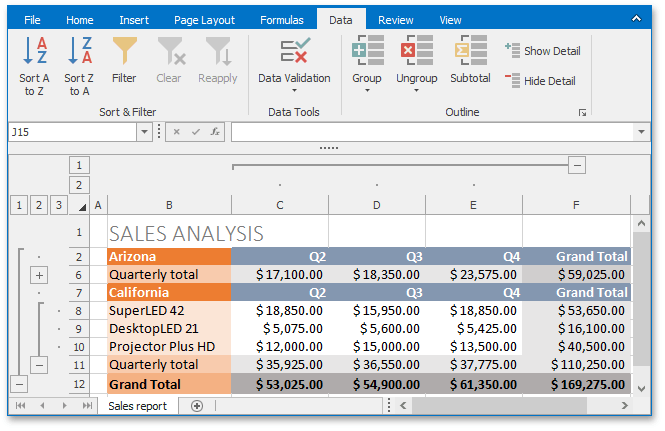
The Spreadsheet Control enables you to split your data into separate groups and show summary information for each group. In particular, you can group related rows or columns manually, create an automatic outline based on subtotal and summary formulas contained in a worksheet, or calculate subtotals for related rows and display summaries above or below detail rows. After you organize your data into groups, you can collapse the desired groups to hide unnecessary rows or columns, and display only required data.
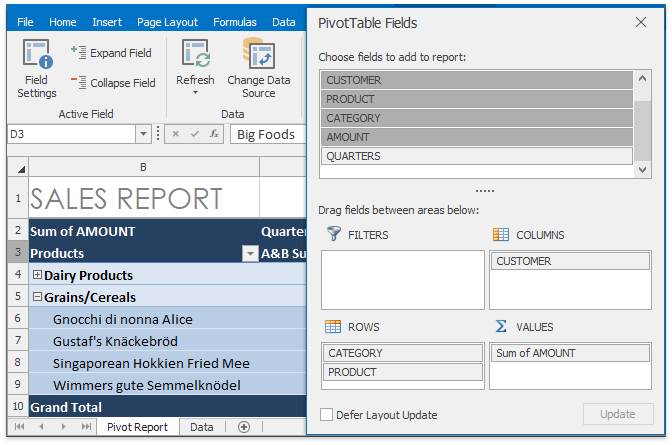
The Spreadsheet Control enables you to create pivot tables making it easy to analyze, categorize and summarize large volumes of raw data within a worksheet.
Pivot tables in the Spreadsheet Control are interactive. Using the PivotTable Field List pane, end-users can add data source fields to the pivot table and arrange them as required. They can freely change the report layout to create a summary table that will fully meet their analysis requirements.
The Spreadsheet Control also provides a wide range of settings allowing you to fine-tune a PivotTable report. In particular, you can select the aggregate function used to summarize values in data fields, specify advanced pivot table options affecting the table layout, display and print settings, format the pivot table by applying a preset or custom style, etc.
From simple lines and rectangles, to banners and callouts, the Spreadsheet Control supports all shape types. You can view, print and export to PDF/HTML documents containing shapes.
The Spreadsheet Control provides you with the capability to add pictures to a spreadsheet document. After you insert a picture, you can freely move it to a new location in a worksheet, resize or rotate it.
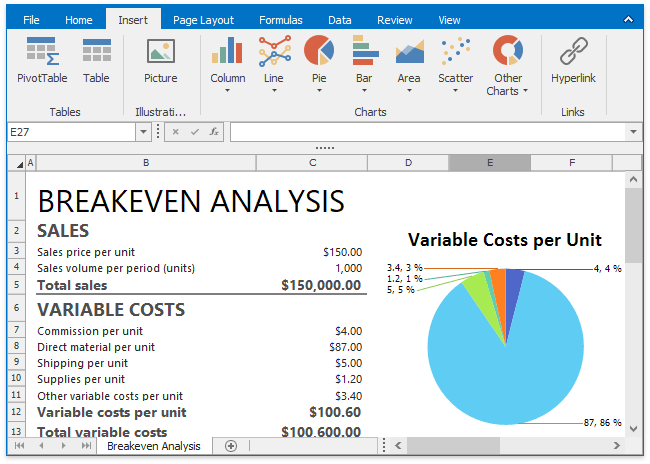
You can summarize worksheet data visually and make data interpretation easier using a variety of 2-D and 3-D charts. Create a basic chart and then customize its appearance for maximum effect. You can apply a predefined chart layout and style, or adjust each chart element manually.
Using the protection functionality of the Spreadsheet Control, you can prevent other users from modifying workbooks, worksheets, or individual cell ranges. You can also specify a password that users must enter to edit a protected document, and unlock specific ranges in a protected worksheet for authorized users. The document can be password encrypted to increase the security. By default, RC4 algorithm is used for XLS files and AES 128 for OpenXML (.XLSX) files.
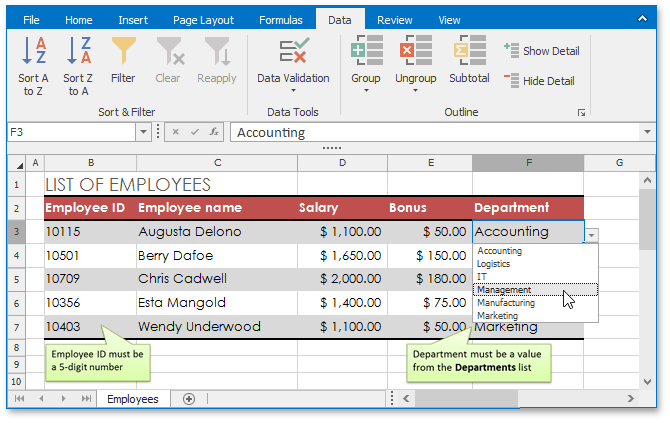
The Spreadsheet Control also provides a high-powered data validation option, which allows you to prevent end-users from entering invalid values into worksheet cells. With data validation, you can create a drop-down list of allowed values, restrict the number of characters entered into a cell, validate data using a comprehensive set of spreadsheet formulas, display an error message, specify an input message explaining what values can be entered into cells, and so forth.
Printing
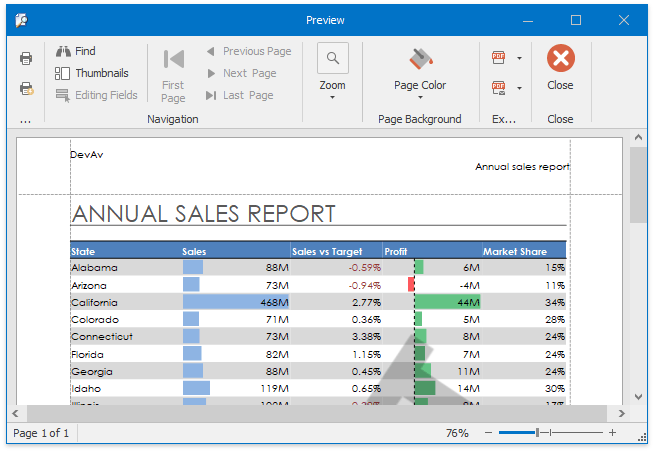
Using the extensive printing capabilities of the Spreadsheet Control, you can print a workbook to a printer or file, invoke the Preview window to preview your document before printing, define a specific area in a worksheet to be printed, scale your data to fit on a specific number of pages, insert row and column page breaks, add headers and footers to the printout and specify other print-related settings (such as page orientation, paper size, page margins, etc.).
Mail Merge
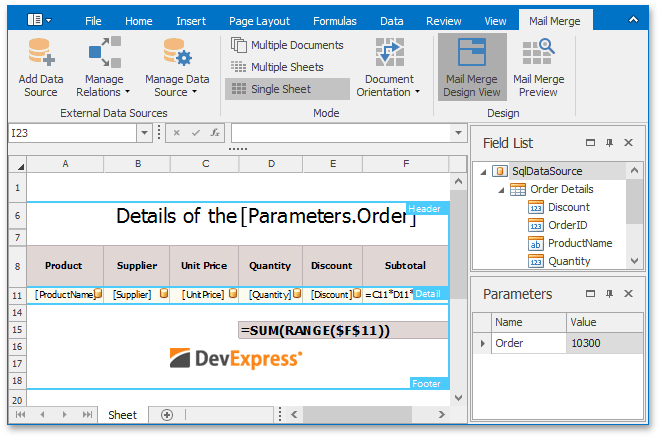
The Spreadsheet Control offers an all-embracing Mail Merge functionality with which you can automatically generate personalized letters and business-centric reports of any complexity. Merged documents are generated based on a template bound to a data source. The Spreadsheet’s mail merge tools enable you and your users to visually design templates and preview mail merge results on-the-fly. Subsequently, these data-bound templates can be saved to a file in a XLS or XLSX format and used later to quickly create new documents and reports as needed.
The Data Source Wizard enables end-users to establish a connection to data sources of different types (a database, an Entity Framework data source, an object data source, or an Excel workbook), configure connection settings, create and modify queries using the Query Designer.
The Field List panel accompanies the Spreadsheet Control and displays the structure of the data source currently used for a mail merge. This panel allows end-users to add data fields to a mail merge template.
Add the Parameters panel to the Spreadsheet Control to allow your users to view and modify mail merge parameters. These parameters can be used for data binding to pass data of a certain type to a report or for constructing a filtering criterion to filter data on the data source level.
For examples on how to perform a mail merge in the Spreadsheet Control and create a master-detail report, refer to the Mail Merge Examples section.