Integration with a Range Control
- 3 minutes to read
When you deal with a large amount of data, you need a handy tool allowing you to track data changes and providing all interaction capabilities (scrolling, zooming, etc.).
A good solution is to use the benefits of two controls: XtraCharts for Windows Forms and a Range control (allows you to select a range of data).
As a result, you will get a tool that simplifies comparison and analysis of different chart series with all support data interaction.
For more information on the Range control, see the Range Control section.
This document consists of the following sections:
Connection to a Range Control
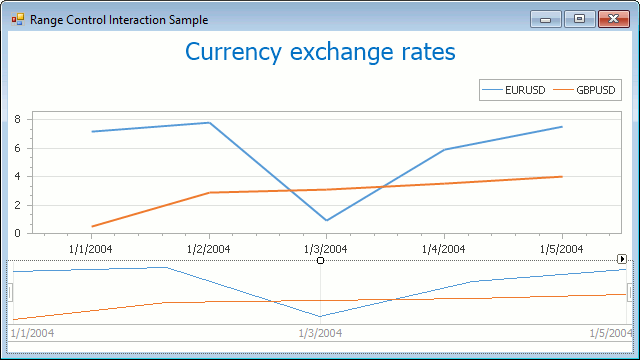
To provide integration, you don’t need to write any lines of code. Just locate a RangeControl in the DX.20.2: Common Controls toolbox tab and drop it onto a form with a ChartControl.
Then, a range control is automatically bound to a chart allowing you to see a chart series in the Range control’s Viewport.
To make sure the binding is provided, you can see the RangeControl.Client property in the Properties windows that is automatically set to chartControl1.
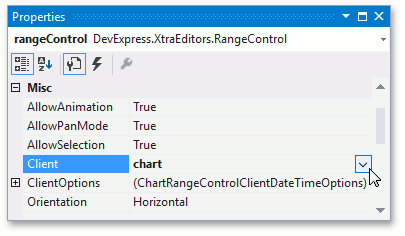
Chart and Range Customization
This section describes properties that can be used to customize a Chart control’s representation in a Range control and explains how they can be accessed at design time.
Specify Series Representation in a Range control
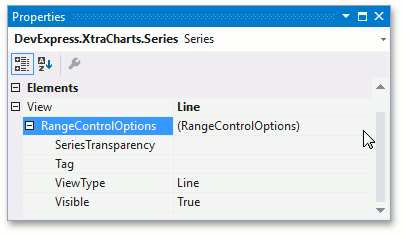
A RangeControlOptions object contains properties that specify the series appearance in a range control’s viewport.
Use the XYDiagram2DSeriesViewBase.RangeControlOptions to get access to the range control options for a series.
The properties that affect series appearance in a range control are detailed in the following table.
| Member | Description |
|---|---|
| RangeControlOptions.ViewType | Gets or sets a value that specifies which view type (either Line or Area) should be used to represent an XYDiagram2D series in a Range Control. |
| RangeControlOptions.SeriesTransparency | Gets or sets the transparency (0-255) to apply to a series displayed in a Range control. |
| RangeControlOptions.ValueLevel | Specifies which level of data points should be used to represent a FinancialIndicator series in a Range Control. |
| RangeControlOptions.Visible | Gets or sets a value indicating whether or not this series should be displayed in a Range Control. |
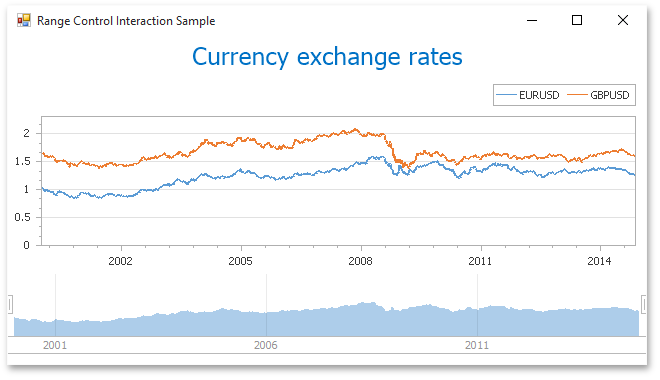
In the image below, the first Line series is hidden in the viewport by setting the RangeControlOptions.Visible property to false, while the second Line series is displayed as an Area (RangeControlOptions.ViewType is set to Area) in the Range control.
Interaction Capabilities
When you run your application, you can execute the following actions:
- Select ranges by using multiple techniques (a chart automatically adjusts axis ranges to a value corresponding to the interval);
- Use animated range selection;
- Zoom in and out;
- Use the touch screen.
For additional information on chart interaction, refer to the End-User Capabilities section.