How to: Create a Snap Chart Programmatically
- 5 minutes to read
The following example demonstrates how to add a chart to a Snap document using the document’s ISnapFieldOwner.CreateSnChart method. This method returns the SnapChart object, which represents the newly created chart and provides properties used to populate the chart with data and fine-tune its layout and appearance settings.
Note
Chart modifications at runtime must be wrapped in the SnapEntity.BeginUpdate and SnapEntity.EndUpdate method calls.
Use the SnapChart.DataSource property to assign a data source to the chart.
Choose one of the following approaches to create chart series and populate them with data:
Generate and populate series dynamically by setting the SnapChart.SeriesDataMember property to the name of the data field containing series names. Specify data fields that contain arguments and data values for series points using the SeriesBase.ArgumentDataMember and SeriesBase.ValueDataMembers properties of the SeriesBase object, which the SnapChart.SeriesTemplate property returns.
Note
If you bind the chart’s arguments or data values to a detail table, the chart displays data for the current master record. The chart displays all records if its arguments or data values are bound to a master table.
- Create chart series manually and supply them with data by adding new Series objects to the chart’s SnapChart.Series collection and specify their argument and value data members.
Use the series’ SeriesBase.View property or SeriesBase.ChangeView method to specify or modify the series view type.
After you finish creating the chart, call the FieldCollection.Update method to update the document fields and display the chart.
Note
A complete sample project is available at https://github.com/DevExpress-Examples/how-to-create-a-chart-to-visualize-data-in-a-snap-report-t569171
using System;
using System.Data;
using DevExpress.XtraCharts;
using DevExpress.Snap.Core.API;

namespace SnapChartAPI
{
    public partial class Form1 : DevExpress.XtraBars.Ribbon.RibbonForm
    {
        public Form1() {
            InitializeComponent();
            #region #CreateChart
            SnapDocument document = snapControl.Document;
            // Insert a chart into the document.
            SnapChart chart = document.CreateSnChart(document.Range.Start);
            chart.BeginUpdate();
            // Create a data table and bind the chart to it.
            chart.DataSource = CreateChartData();

            // Populate chart series with data.
            chart.SeriesDataMember = "Year";
            chart.SeriesTemplate.ArgumentDataMember = "Region";
            chart.SeriesTemplate.ValueDataMembers.AddRange(new string[] { "Sales" });

            // Specify the series view options.
            chart.SeriesTemplate.ChangeView(ViewType.Bar);
            chart.SeriesNameTemplate.BeginText = "Year: ";

            // Add the chart title.
            ChartTitle chartTitle = new ChartTitle();
            chartTitle.Text = "DevAV Sales by Regions";
            chartTitle.Alignment = System.Drawing.StringAlignment.Center;
            chartTitle.Dock = ChartTitleDockStyle.Top;
            chart.Titles.Add(chartTitle);

            // Add the value axis title.
            XYDiagram diagram = (XYDiagram)chart.Diagram;
            diagram.AxisY.Title.Visibility = DevExpress.Utils.DefaultBoolean.True;
            diagram.AxisY.Title.Alignment = System.Drawing.StringAlignment.Center;
            diagram.AxisY.Title.Text = "Millions of Dollars";

            // Set the chart size.
            chart.Size = new System.Drawing.Size(640, 425);
            chart.UseExplicitSize = true;

            // Change the chart palette.
            chart.PaletteName = "Slipstream";
            chart.EndUpdate();

            document.Fields.Update();
            #endregion #CreateChart
        }

        #region #CreateDataSource
        DataView CreateChartData() {
            int prevYear = DateTime.Now.Year - 1;

            // Create a data table.
            DataTable table = new DataTable("ChartData");

            // Add three columns to the table.
            table.Columns.Add("Year", typeof(int));
            table.Columns.Add("Region", typeof(string));
            table.Columns.Add("Sales", typeof(decimal));

            // Add data rows to the table.
            table.Rows.Add(prevYear - 2, "Asia", 4.2372D);
            table.Rows.Add(prevYear - 2, "Australia", 1.7871D);
            table.Rows.Add(prevYear - 2, "Europe", 3.0884D);
            table.Rows.Add(prevYear - 2, "North America", 3.4855D);
            table.Rows.Add(prevYear - 2, "South America", 1.6027D);

            table.Rows.Add(prevYear - 1, "Asia", 4.7685D);
            table.Rows.Add(prevYear - 1, "Australia", 1.9576D);
            table.Rows.Add(prevYear - 1, "Europe", 3.3579D);
            table.Rows.Add(prevYear - 1, "North America", 3.7477D);
            table.Rows.Add(prevYear - 1, "South America", 1.8237D);

            table.Rows.Add(prevYear, "Asia", 5.2890D);
            table.Rows.Add(prevYear, "Australia", 2.2727D);
            table.Rows.Add(prevYear, "Europe", 3.7257D);
            table.Rows.Add(prevYear, "North America", 4.1825D);
            table.Rows.Add(prevYear, "South America", 2.1172D);

            return new DataView(table);
        }
        #endregion #CreateDataSource
    }
}
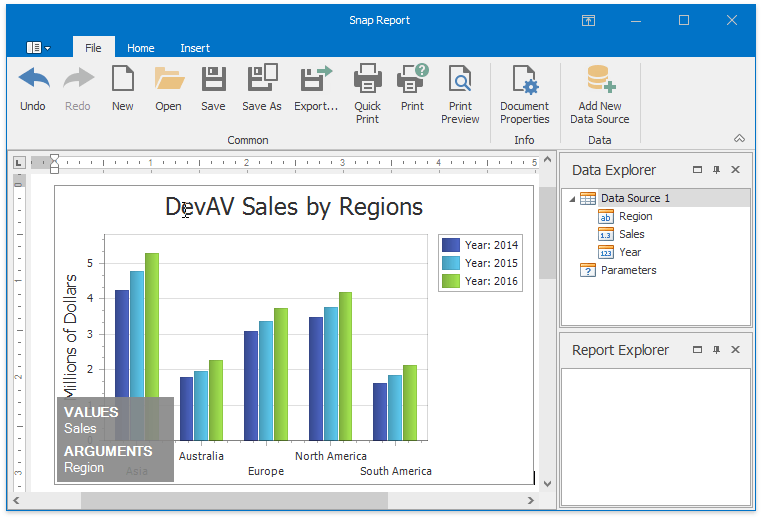
The following image shows the result of executing the code above: