Integration with a Data Grid, Vertical Grid, Tree List or List Box via ControlRowSource
- 3 minutes to read
This topic explains how to populate a chart with a Data Grid‘s (Vertical Grid‘s, Tree List‘s or List Box’s) data.
The following approaches are available:
Populate a chart at the design time
This section describes how to populate a chart with a Data Grid’s data at design time.
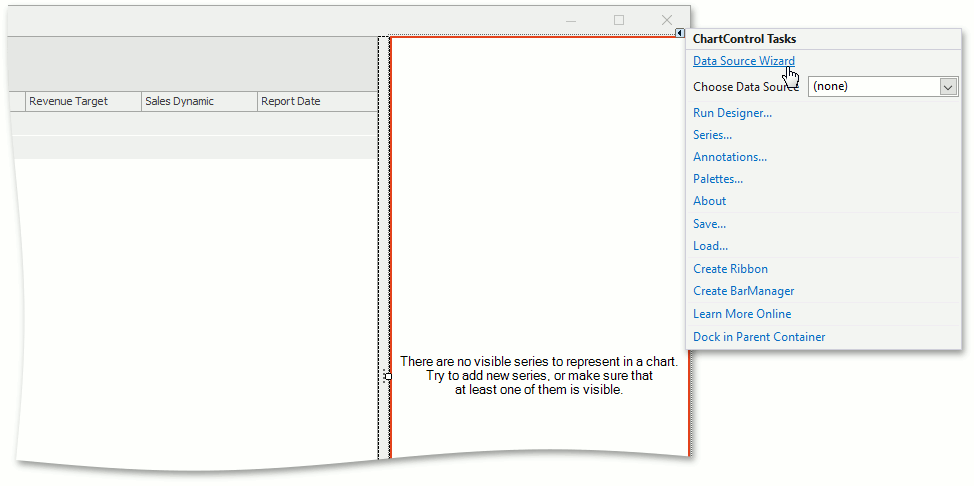
Select a Chart Control instance, click its Smart Tag and click the Data Source Wizard item.
Locate the Control Row Source technology and click it, select the control that should provide its rows and click Next.
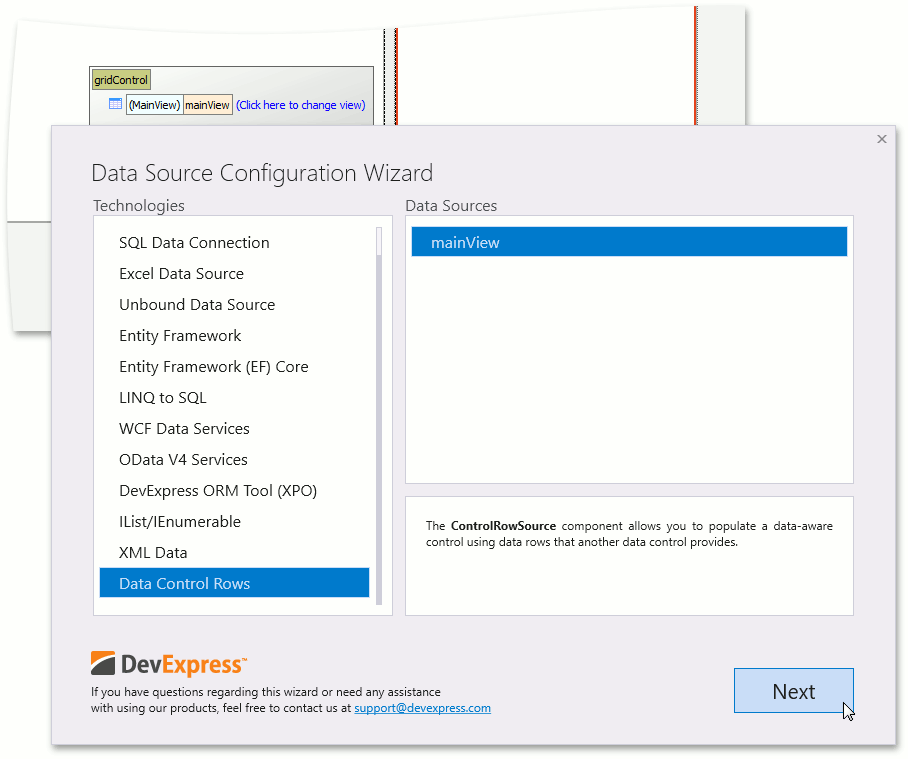
Important
The ControlRowSource is not available in the Toolbox. Only the Data Source Configuration Wizard can create a new instance of this class at design time.
Note
You can use the ControlRowSource control to provide a GridControl‘s, TreeListColumn‘s VGridControl‘s and ListBoxControl‘s data to a chart.
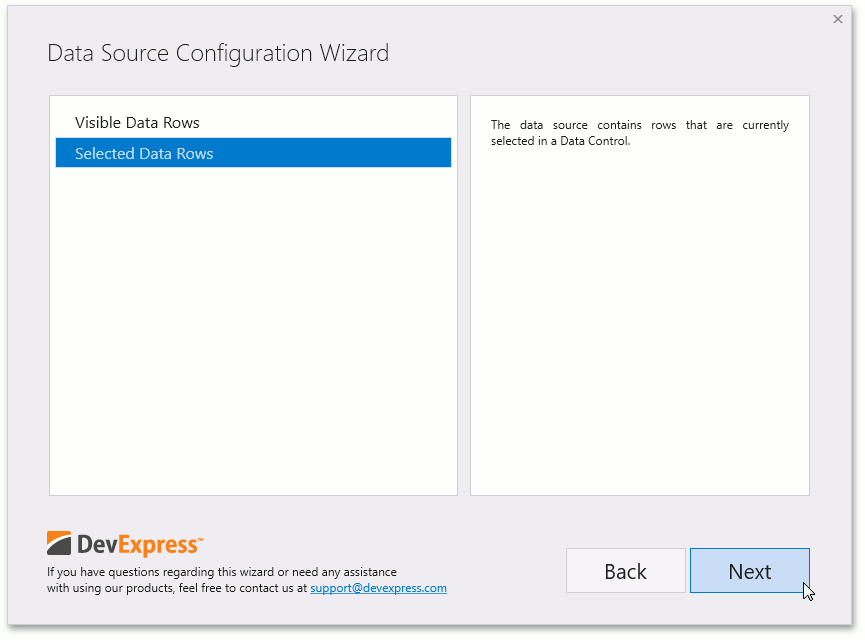
Select the type of rows the chart should visualize.
Select the data columns provided by a Row Control that the chart should use as the Series Member, Argument Member, and Value Member to generate series. Refer to the Series Template topic to learn more about series generation.
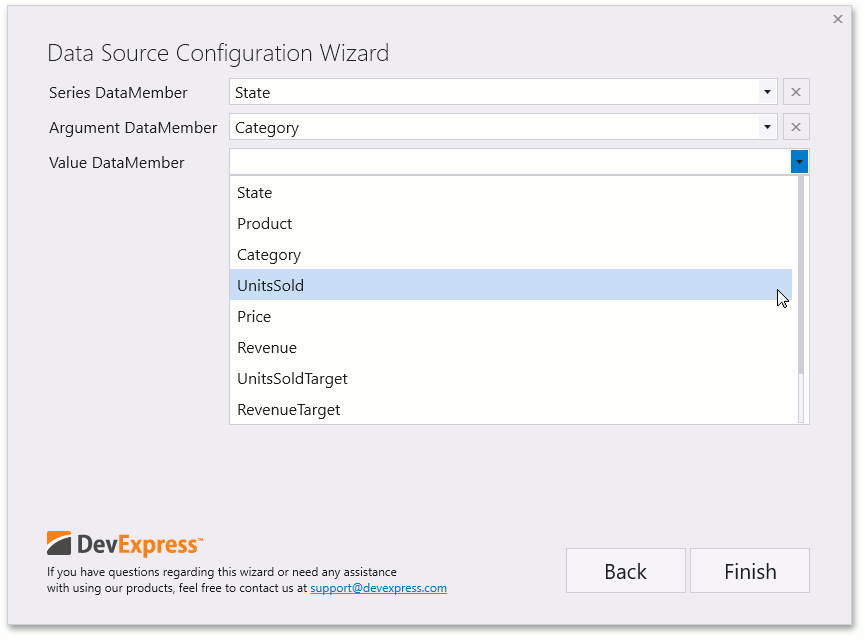
- Click Finish to save changes.
After performing the previous steps, the chart visualizes the selected data rows.
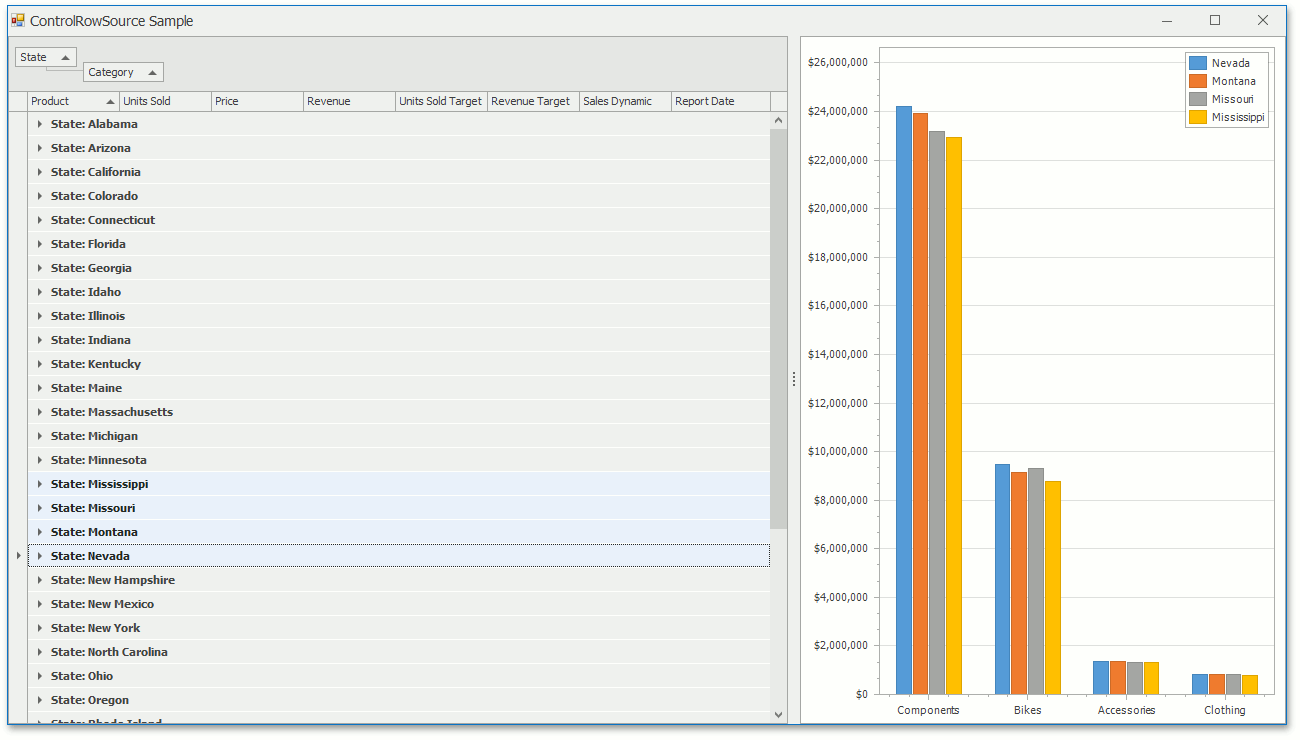
Populate a chart at the runtime
You can connect a chart at runtime using the following code if it cannot be attached to a grid control at the design time:
The ControlRowSource component allows the Chart Control to visualize Grid data. To use the source component, create a new instance of it, configure its properties and assign it to the ChartControl.DataSource property.
Note
A complete sample project is available at https://github.com/DevExpress-Examples/how-to-visualize-data-rows-that-a-data-grid-contains-using-a-chart-t554382
// Assign a new instance of ControlRowSource to the chart's DataSource property.
chartControl.DataSource = new ControlRowSource() {
    Control = mainView,
    ControlRows = ControlRows.Selected
};
// Specify chart properties that configures series to display.
chartControl.SeriesDataMember = "State";

SeriesBase seriesTemplate = chartControl.SeriesTemplate;
seriesTemplate.ArgumentDataMember = "Category";
seriesTemplate.ValueDataMembers.AddRange("Revenue");
// Configure additional chart properties.
seriesTemplate.CrosshairLabelPattern = "{S}: {V:C2}";
seriesTemplate.SeriesPointsSorting = SortingMode.Descending;
seriesTemplate.SeriesPointsSortingKey = SeriesPointKey.Value_1;
seriesTemplate.SummaryFunction = "SUM([Revenue])";

XYDiagram diagram = (XYDiagram)chartControl.Diagram;
diagram.AxisY.Label.TextPattern = "{V:C0}";

chartControl.Legend.AlignmentHorizontal = LegendAlignmentHorizontal.Right;
chartControl.Legend.AlignmentVertical = LegendAlignmentVertical.Top;