How to: Group Items in a Pivot Table
- 7 minutes to read
Grouping can help you to get a clearer view of data and show only data you want to analyze.
Group a Pivot Table by Date
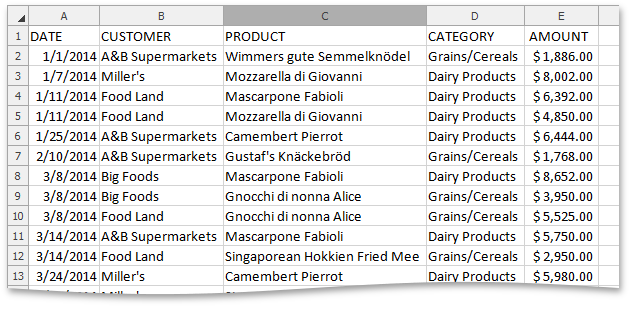
Start with a raw data table that shows sales figures for a customer and a product on a certain date.
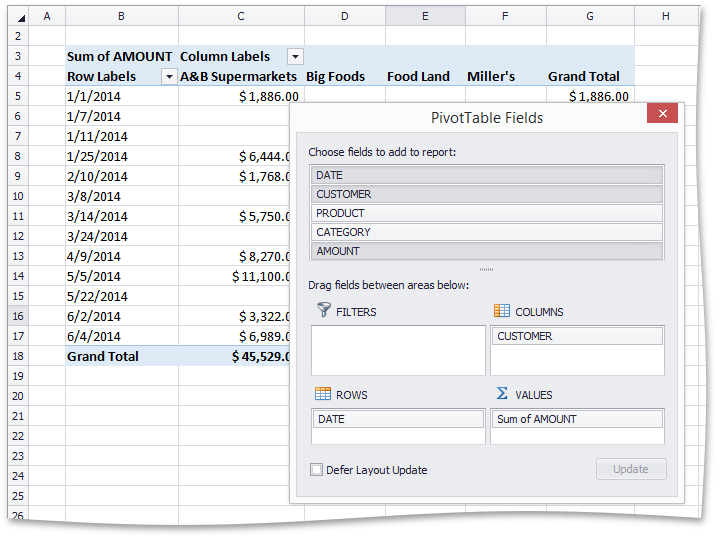
Create a pivot table that shows the total sum of all sales for each customer on each date.
To group the sales amount by month and quarter, perform the following steps.
- Right click on left column of the pivot table (containing the dates) and select Group….
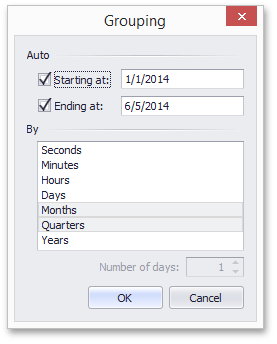
The Grouping dialog is invoked. Select Months and Quarters and click OK.
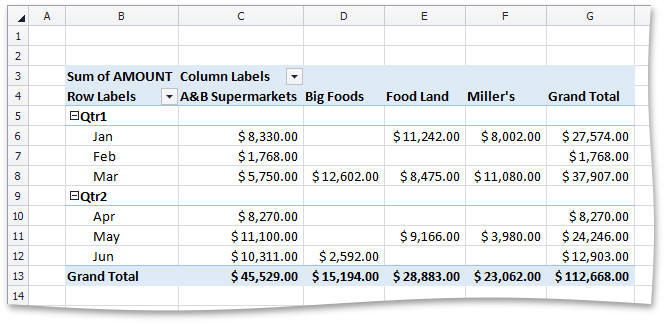
The result is shown in the picture below.
You can also group the pivot table in code, using the PivotField.GroupItems method with the combination of PivotFieldGroupByType.Quarters and PivotFieldGroupByType.Months values passed as a single parameter.
This code snippet groups the field by month and quarter.
Note
A complete sample project is available at https://github.com/DevExpress-Examples/winforms-spreadsheet-pivot-table-api-t298650
Worksheet worksheet = workbook.Worksheets["Report8"];
workbook.Worksheets.ActiveWorksheet = worksheet;

// Access the pivot table by its name in the collection.
PivotTable pivotTable = worksheet.PivotTables["PivotTable1"];
// Access the "DATE" field by its name in the collection.
PivotField field = pivotTable.Fields["DATE"];
// Group field items by quarters and months.
field.GroupItems(PivotFieldGroupByType.Quarters | PivotFieldGroupByType.Months);
Group a Pivot Table by Range
Start with a raw data table that shows sales figures for a product.
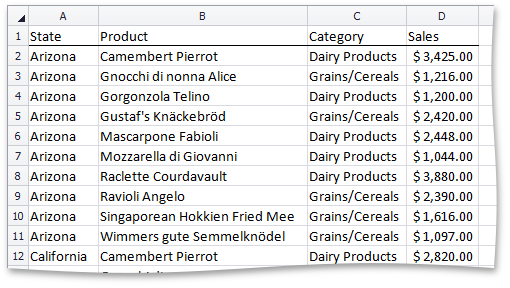
Create a pivot table that shows the number of sales for each product.
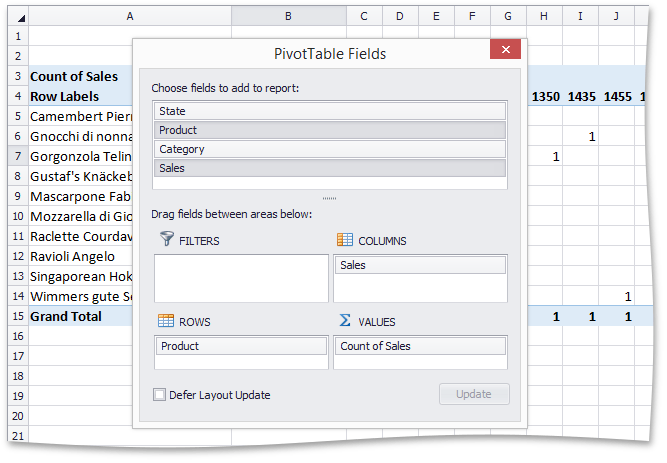
To group the sales amounts by thousands, perform the following steps.
- Right click on top row of the pivot table (containing the sales amounts) and select Group…
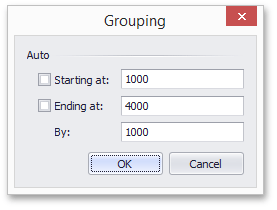
The Grouping dialog is invoked. Type in start value, end value, interval and click OK.
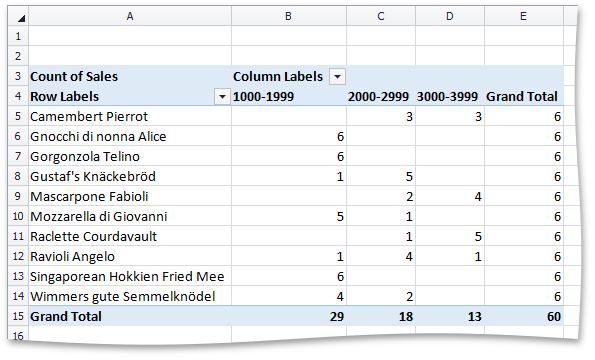
The result is shown in the picture below.
You can also group the pivot table in code, using the PivotField.GroupItems method with the PivotFieldGroupByType.NumericRanges parameter specifying the smallest and largest number to group the field and an interval for each group.
Note
A complete sample project is available at https://github.com/DevExpress-Examples/winforms-spreadsheet-pivot-table-api-t298650
Worksheet worksheet = workbook.Worksheets["Report12"];
workbook.Worksheets.ActiveWorksheet = worksheet;

// Access the pivot table by its name in the collection.
PivotTable pivotTable = worksheet.PivotTables["PivotTable1"];
// Access the "Usual Hours Worked" field by its name in the collection.
PivotField field = pivotTable.Fields["Sales"];
// Group field items from 1000 to 4000 by 1000.
field.GroupItems(1000, 4000, 1000, PivotFieldGroupByType.NumericRanges);
Group Selected Items
You can select specific items and group them.
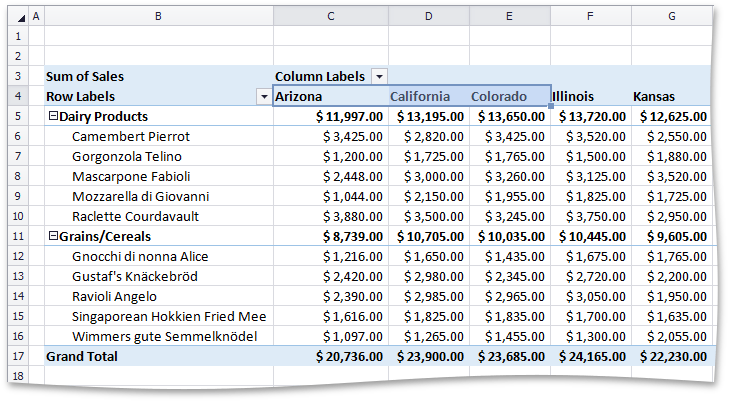
In the pivot table shown at the picture below, select the first three items - Arizona, California and Colorado.
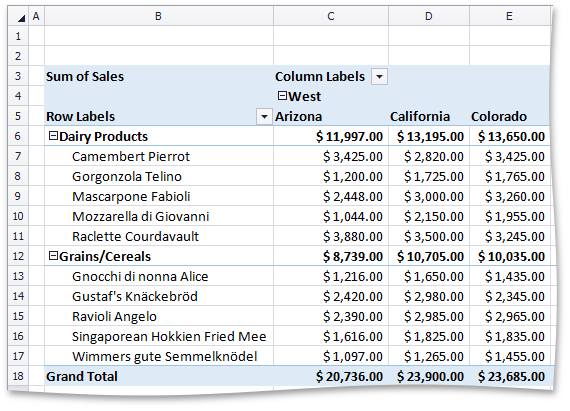
Right click and select Group…. Press F2 to change the name of the group from Group to West. Press Enter to finish. The result is as follows.
You can also group the pivot table in code, using the PivotField.GroupItems method with a list of item indices (0, 1, 2) passed as a parameter.
Note
A complete sample project is available at https://github.com/DevExpress-Examples/winforms-spreadsheet-pivot-table-api-t298650
Worksheet worksheet = workbook.Worksheets["Report11"];
workbook.Worksheets.ActiveWorksheet = worksheet;

// Access the pivot table by its name in the collection.
PivotTable pivotTable = worksheet.PivotTables["PivotTable1"];
// Access the "State" field by its name in the collection.
PivotField field = pivotTable.Fields["State"];
// Add the "State" field to the column axis area.
pivotTable.ColumnFields.Add(field);

// Group the first three items in the field.
IEnumerable<int> items = new List<int>() { 0, 1, 2 };
field.GroupItems(items);
// Access the created grouped field by its index in the field collection.
int groupedFieldIndex = pivotTable.Fields.Count - 1;
PivotField groupedField = pivotTable.Fields[groupedFieldIndex];
// Set the grouped item caption to "West".
groupedField.Items[0].Caption = "West";
Ungroup Data
To ungroup the values in a pivot table, do the following.
- Right click on the row or column of the pivot table containing the grouped values.
- Select the option Ungroup….
To ungroup a grouped field in code, use the PivotField.UngroupItems method without parameters.
Use the PivotField.UngroupItems method with a name of the group as a parameter to ungroup only that group of items, as illustrated in the following code snippet.
The following code creates two groupings with different items and subsequently ungroups the first group of items.
Note
A complete sample project is available at https://github.com/DevExpress-Examples/winforms-spreadsheet-pivot-table-api-t298650
Worksheet worksheet = workbook.Worksheets["Report11"];
workbook.Worksheets.ActiveWorksheet = worksheet;

// Access the pivot table by its name in the collection
PivotTable pivotTable = worksheet.PivotTables["PivotTable1"];
// Access the "State" field by its name in the collection.
PivotField field = pivotTable.Fields["State"];
// Add the "State" field to the column axis area.
pivotTable.ColumnFields.Add(field);

// Group the first three items in the field.
IEnumerable<int> items = new List<int>() { 0, 1, 2 };
field.GroupItems(items);
// Access the created grouped field by its index in the field collection.
int groupedFieldIndex = pivotTable.Fields.Count - 1;
PivotField groupedField = pivotTable.Fields[groupedFieldIndex];
// Set the grouped item caption to "West".
groupedField.Items[0].Caption = "West";

// Group the remaining field items.
items = new List<int>() { 3, 4, 5 };
field.GroupItems(items);
// Set the grouped item caption to "Midwest"
groupedField.Items[1].Caption = "Midwest";

// Ungroup the "West" item.
items = new List<int> { 0 };
groupedField.UngroupItems(items);