Pivot Table Structure
- 2 minutes to read
This topic provides general information about the structure of a PivotTable report.
A pivot table refers to each column in the source range as a field. Each field is made up of items - unique data entries contained in this field.
In the initial stage, when you add a pivot table to a worksheet, it contains no data. To populate the created report with data, you should place the available data source fields into one of the four PivotTable sections.
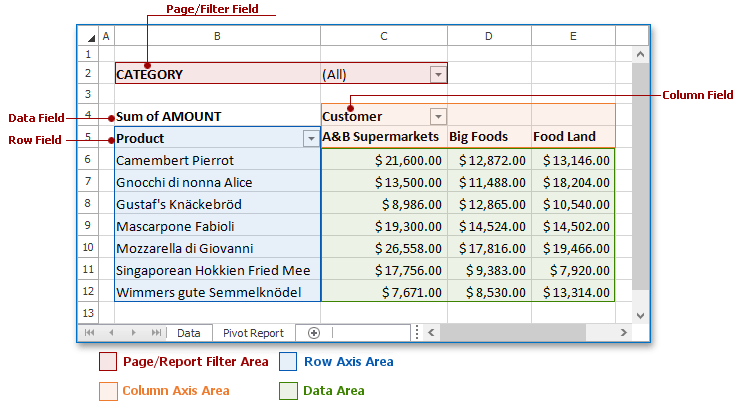
Row Axis Area/Row Area
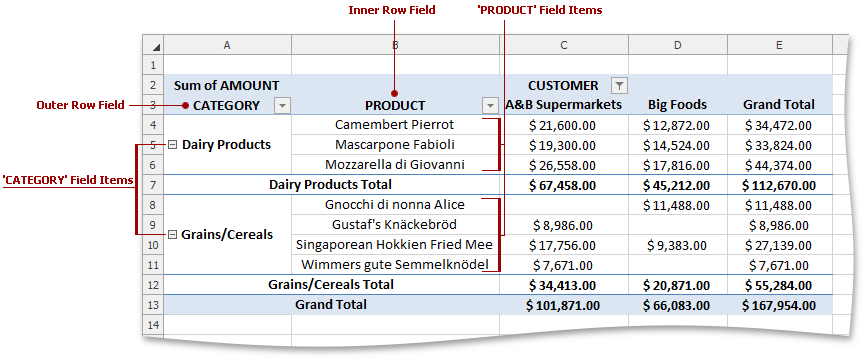
Contains fields used to group report data by rows. A pivot table containing multiple row fields has one inner row field (the one located closest to the data area). All other row fields are regarded as outer row fields. Items of the outermost row field are displayed only once, while items in the rest of the row fields can be repeated.
Column Axis Area/Column Area
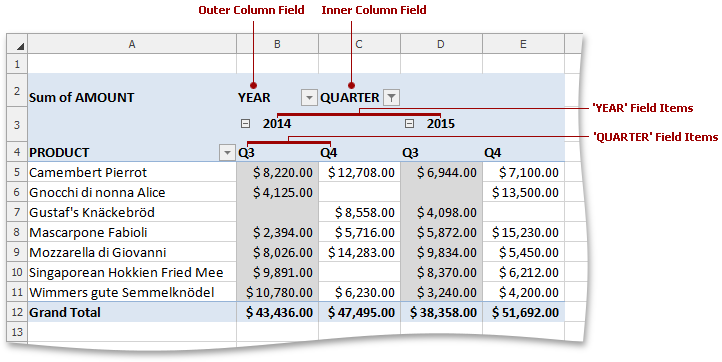
Contains fields used to break report data into categories by columns. A pivot table containing multiple column fields has one inner column field. All other column fields are regarded as outer column fields. Items of the outermost column field are displayed only once, while items in the rest of the column fields can be repeated.
Data Area
Contains fields against which summaries are calculated. As a rule, data fields contain numeric values, which are summarized with the Sum function, but you can change the calculation type by selecting one of the predefined functions (Count, Average, Min, Max, Product, Count Numbers, StdDev, StdDevp, Var, or Varp). For data fields containing textual values, the Count summary function is used by default.
Page/Report Filter Area
Contains fields used to filter the entire PivotTable report to display data for the selected items.
For details on how to use the Pivot Table API to create a pivot table and organize its structure, refer to the How to: Create a Pivot Table example.