Trend Indicators
This document describes the Trend indicators used in financial charting.
Trend indicators show the tendency of series values to move in a specific direction over time.
For a 2D XY-series, you can show any number of trend indicators of the following types.
- Bollinger Bands (BollingerBands)
- Mass Index (MassIndex);
- Standard Deviation (StandardDeviation);
To add an indicator to a series, add the required class object to the XYDiagram2DSeriesViewBase.Indicators collection.
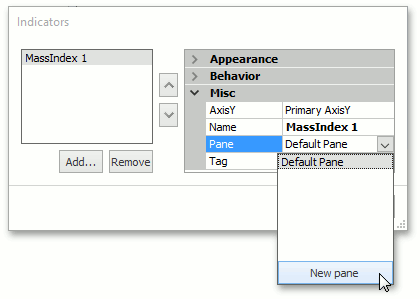
The Mass Index and Standard Deviation indicators can be plotted on a separate pane. For this, specify the SeparatePaneIndicator.Pane and SeparatePaneIndicator.AxisY properties.
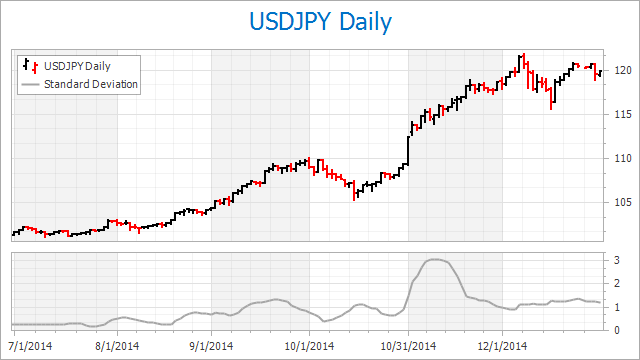
The following image demonstrates the Standard Deviation indicator plotted on a separate pane.
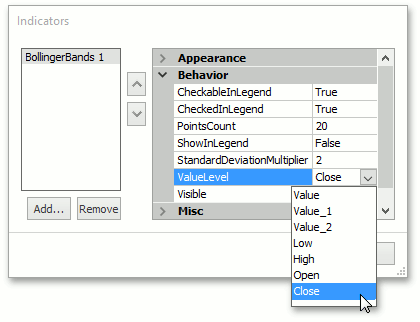
For the Bollinger Bands and Standard Deviation indicators, you can specify which series point value should be used to calculate the indicator using the BollingerBands.ValueLevel or StandardDeviation.ValueLevel property.
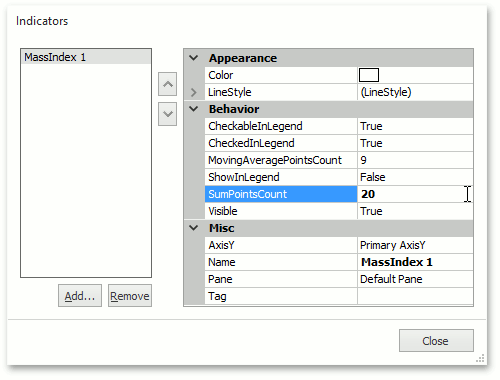
All of these indicators have options specifying the point count required to calculate a value of an indicator. For Bollinger Bands, it is BollingerBands.PointsCount; for Mass Index - MassIndex.MovingAveragePointsCount and MassIndex.SumPointsCount; for Standard Deviation - StandardDeviation.PointsCount.