How to: Create a Pivot Table
- 3 minutes to read
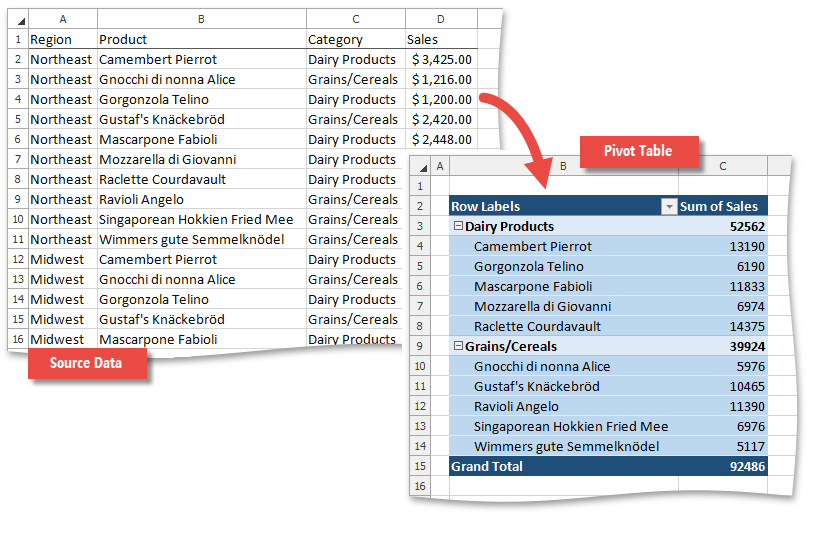
The following examples demonstrate how to use the Pivot Table API to create a pivot table, which summarizes data in a cell range.
To create a new pivot table, use the PivotTableCollection.Add method of the Worksheet.PivotTables collection accessed for a worksheet where the report should be located. You can use a cell range as the data source for your PivotTable report, or base it on the data cache of the existing pivot table (for details, see PivotCache).
To fill the created pivot table with data, add the necessary fields to it. All pivot fields are stored in the PivotFieldCollection collection returned by the PivotTable.Fields property. To add a field to the PivotTable report, access the required field by its name in the collection (by default, field names originate from the column labels in the source range) and move it to one of four PivotTable areas, listed in the table below.
To add a field to | Do this |
|---|---|
|
| Use the PivotFieldReferenceCollection.Add method of the PivotTable.RowFields collection. |
|
| Use the PivotFieldReferenceCollection.Add method of the PivotTable.ColumnFields collection. |
|
| Use the PivotPageFieldCollection.Add method of the PivotTable.PageFields collection. |
|
| Use the PivotDataFieldCollection.Add method of the PivotTable.DataFields collection. |


Create a Pivot Table Using a Cell Range as the Data Source
Note
A complete sample project is available at https://github.com/DevExpress-Examples/winforms-spreadsheet-pivot-table-api-t298650
Worksheet sourceWorksheet = workbook.Worksheets["Data1"];
Worksheet worksheet = workbook.Worksheets.Add();
workbook.Worksheets.ActiveWorksheet = worksheet;

// Create a pivot table using the cell range "A1:D41" as the data source.
PivotTable pivotTable = worksheet.PivotTables.Add(sourceWorksheet["A1:D41"], worksheet["B2"]);

// Add the "Category" field to the row axis area.
pivotTable.RowFields.Add(pivotTable.Fields["Category"]);
// Add the "Product" field to the row axis area.
pivotTable.RowFields.Add(pivotTable.Fields["Product"]);
// Add the "Sales" field to the data area.
pivotTable.DataFields.Add(pivotTable.Fields["Sales"]);
Create a Pivot Table based on the PivotTable Cache
Note
A complete sample project is available at https://github.com/DevExpress-Examples/winforms-spreadsheet-pivot-table-api-t298650
Worksheet worksheet = workbook.Worksheets.Add();
workbook.Worksheets.ActiveWorksheet = worksheet;

// Create a pivot table based on the specified PivotTable cache.
PivotCache cache = workbook.Worksheets["Report1"].PivotTables["PivotTable1"].Cache;
PivotTable pivotTable = worksheet.PivotTables.Add(cache, worksheet["B2"]);

// Add the "Category" field to the row axis area.
pivotTable.RowFields.Add(pivotTable.Fields["Category"]);
// Add the "Product" field to the row axis area.
pivotTable.RowFields.Add(pivotTable.Fields["Product"]);
// Add the "Sales" field to the data area.
pivotTable.DataFields.Add(pivotTable.Fields["Sales"]);

// Set the default style for the pivot table.
pivotTable.Style = workbook.TableStyles.DefaultPivotStyle;
PivotTable Report Limitations
While creating pivot tables, take into account the following restrictions.
Feature | Limit |
|---|---|
Number of pivot tables on a worksheet | Limited by available memory |
Number of row fields | Limited by available memory |
Number of column fields | Limited by available memory |
Number of page fields | 256 |
Number of data fields | 256 |
Number of unique items per field | 1,048,576 for XLSX format 32,500 for XLS format |