Pivot Tables in Spreadsheet Documents
- 4 minutes to read
This document introduces the Pivot Table functionality that allows you to perform complex analysis of raw data in a worksheet using pivot tables.
A pivot table represents a summary table used to explore, analyze and aggregate huge amounts of data in a worksheet. It helps break your data into categories and subcategories, and automatically calculates subtotals and grand totals using the most suitable summary function from a predefined list.
Pivot tables in the SpreadsheetControl are interactive. That means you can easily change the layout of the existing report to create a new summary table that will fully meet your analysis requirements. For example, the image gallery below shows three PivotTable reports that allow you to analyze the same business data in different forms.
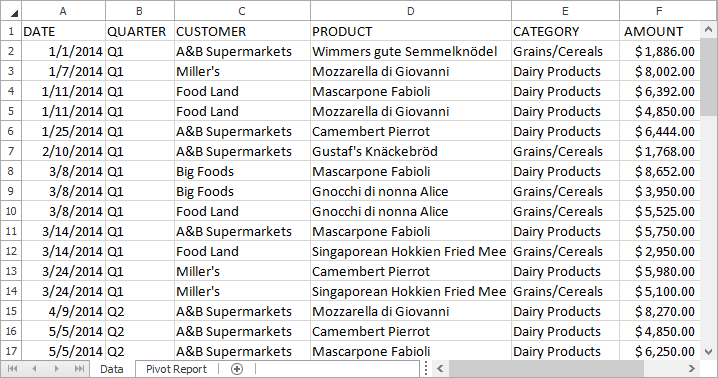
Source Data
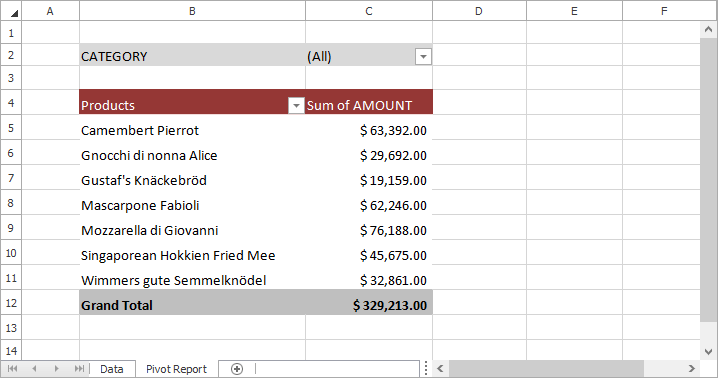
One-dimensional PivotTable Report
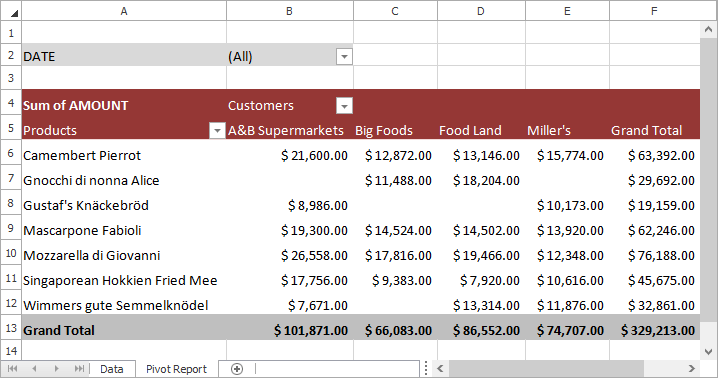
Two-dimensional PivotTable Report
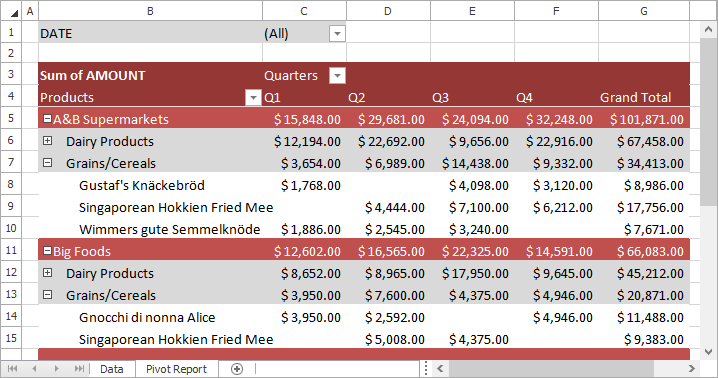
Multi-dimensional PivotTable Report
Pivot Table Functionality
The SpreadsheetControl provides a comprehensive and straightforward Pivot Table API that enables you to create and modify pivot tables in code.
In particular, you can do the following:
Create a pivot table using a cell range as a data source or base your report on the data cache of the existing pivot table.
Important
Currently, the SpreadsheetControl uses only worksheet data as a data source for a pivot table. External data sources (such as ODC files, OLAP cubes, relational databases, XML files, etc.) are not supported.
- Organize the structure of a pivot table by adding and arranging its fields.
- Calculate summaries against data fields using a wide range of preset aggregate functions.
- Change source data for a pivot table.
- Refresh a pivot table to obtain the latest data from the source.
- Move a pivot table to a new location.
- Display a pivot table in a compact, outline, or tabular form.
- Format a pivot table by applying a built-in or custom style.
- Display or hide subtotals and grand totals for rows and columns.
- Insert a blank row after each group of items.
- Sort field items in descending or ascending order.
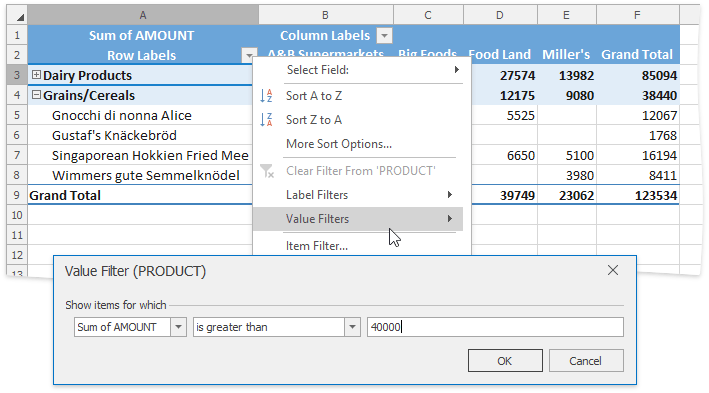
- Apply a filter to a pivot table to show or hide specific items, construct the filter expression to display only items that meet the specified condition, or filter report data based on calculated values.
- Create calculated fields and items.
- Group items in a PivotTable report in a custom way to create new subsets of data.
For details, refer to the Pivot Tables section of examples.
Manage Pivot Tables in the User Interface
Insert a Pivot Table
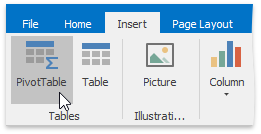
End-users can create a pivot table using the Create PivotTable dialog, which can be invoked by clicking the PivotTable button on the Insert tab, in the Tables group.
Organize the PivotTable Structure
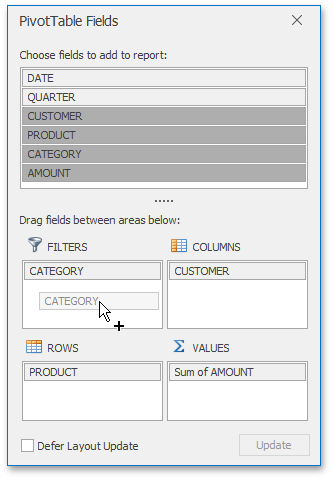
End-users can use the Field List pane to add fields to the pivot table and arrange them as required using drag and drop.
Adjust the PivotTable Options
After end-users create a pivot table and lay out its fields, they can fine-tune their report using various commands located on the PivotTable Tools contextual tab, which appears when any cell in the pivot table is selected.
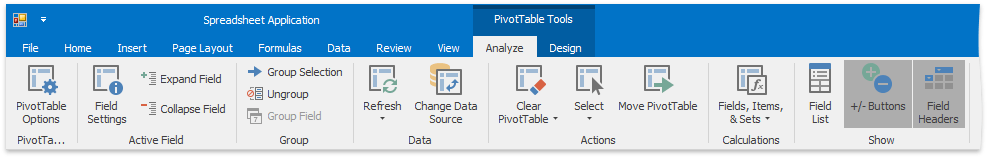
Options on the Analyze tab allow end-users to change the underlying settings of a pivot table. They can specify various options affecting the table layout, display and print settings, select the aggregate function used to summarize values in the data field, change the data source for the report, refresh the pivot table, change its location, display or hide the Field List, etc.
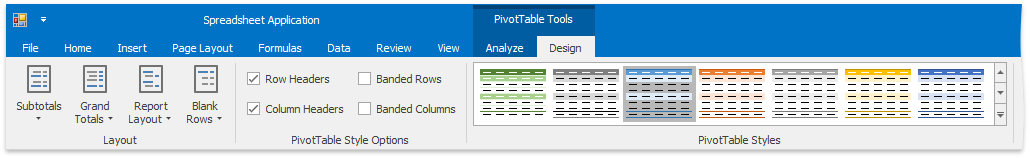
The Design tab of the PivotTable Tools contextual tab provides a wide range of formatting options enabling end-users to change the pivot table appearance. In particular, end-users can adjust the report layout by displaying the pivot table in compact, outline, or tabular form, show or hide subtotals and grand totals, apply a style to the pivot table and configure style options.
Explore the PivotTable Data
After a pivot table is completely organized and adjusted, end-users can easily explore the resulting report: sort field items, expand or collapse individual categories of data, and apply a filter to the pivot table to display only significant values.
Online Video
To learn the basics of working with pivot tables in the SpreadsheetControl, watch the following introductory video.