Tutorial: Custom Grouping Algorithms
- 3 minutes to read
This walkthrough is a transcript of the Custom Grouping Algorithms video available on the DevExpress YouTube Channel.
By default, data groups are formed by putting identical values into each group. Although the grid provides a few other built-in algorithms, sometimes you need to implement your own logic, which is done using the GridView.CustomColumnGroup event. You will learn how to handle this event in order to change a numeric column’s data grouping logic so that groups contain ranges of values starting with 0 to 99.99, then 100 to 199.99 and so on.
Default Behavior
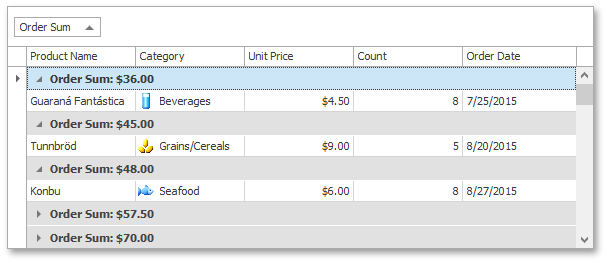
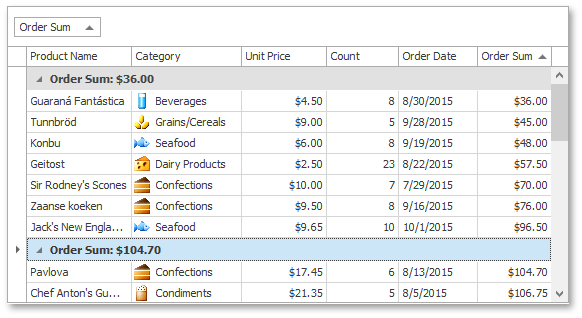
When you group the grid’s data against the Order Sum column, by default, groups are formed based on unique values in that column.
Implementing Custom Grouping Logic
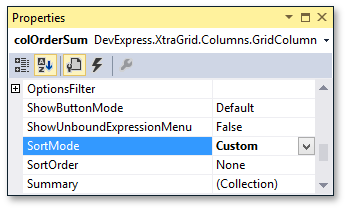
Switch to design-time and first of all, enable custom sorting mode for this column by setting the GridColumn.SortMode property to ColumnSortMode.Custom.
After that, select the grid View and handle its GridView.CustomColumnGroup event. The column being processed is specified by the event’s CustomColumnSortEventArgs.Column parameter. The event handler compares two rows with values specified by the CustomColumnSortEventArgs.Value1 and CustomColumnSortEventArgs.Value2 parameters. Since you combine values into groups corresponding to hundreds, divide the values by 100 and compare the results. To place all values above 1000 into the same group, the handler assumes that results are equal if they are both greater than 10. The CustomColumnSortEventArgs.Result parameter is set to 0 in that case. Other values undergo standard comparison.
The event’s CustomColumnSortEventArgs.Handled parameter is set to true to prevent the default comparison mechanism from being invoked after event execution.
private void gridView_CustomColumnGroup(object sender, DevExpress.XtraGrid.Views.Base.CustomColumnSortEventArgs e) {
    if (e.Column.FieldName == "Order Sum") {
        e.Handled = true;
        double val1 = Math.Floor(Convert.ToDouble(e.Value1) / 100);
        double val2 = Math.Floor(Convert.ToDouble(e.Value2) / 100);
        if (val1 >= 10 && val2 >= 10)
            e.Result = 0;
        else e.Result = System.Collections.Comparer.Default.Compare(val1, val2);
    }
}
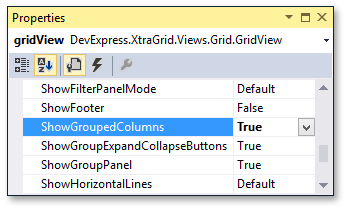
To better illustrate how this code works, the grouping column values should be visible even when data is grouped. To enable this behavior, expand GridView.OptionsView and set the GridOptionsView.ShowGroupedColumns option to true.
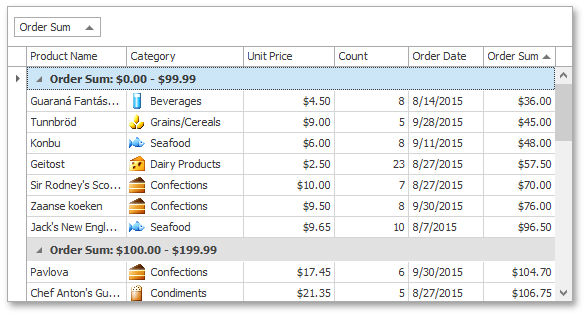
Now run the application and group grid data by the Order Sum column. As a result, rows are combined into the specified intervals. However, group rows display the first value in a corresponding group, thus misleading end-users. This can also be fixed.
Providing Custom Display Text for Group Rows
Return to design time and subscribe to the ColumnView.CustomColumnDisplayText event. Check the event’s CustomColumnDisplayTextEventArgs.Column and CustomColumnDisplayTextEventArgs.IsForGroupRow parameters. The first parameter specifies the column currently being processed, while the second parameter indicates whether the event is called to customize group row display text. The CustomColumnDisplayTextEventArgs.GroupRowHandle parameter returns the currently processed group row. To change the group row’s display text, use the event’s CustomColumnDisplayTextEventArgs.DisplayText parameter.
using DevExpress.XtraGrid.Views.Grid;
//...
private void gridView_CustomColumnDisplayText(object sender, DevExpress.XtraGrid.Views.Base.CustomColumnDisplayTextEventArgs e) {
    GridView view = sender as GridView;
    if (view == null) return;
    if (e.Column.FieldName == "Order Sum" && e.IsForGroupRow) {
        double rowValue = Convert.ToDouble(view.GetGroupRowValue(e.GroupRowHandle, colOrderSum));
        double val = Math.Floor(rowValue / 100);
        if (val >= 10)
            e.DisplayText = string.Format(">= {0:c} ", val * 100);
        else e.DisplayText = string.Format("{0:c} - {1:c} ", val * 100, (val + 1) * 100 - 0.01);
    }
}
Run the application and group data by the Order Sum column once again. Group rows will now display custom text that correctly identifies the intervals.