Area Series Views
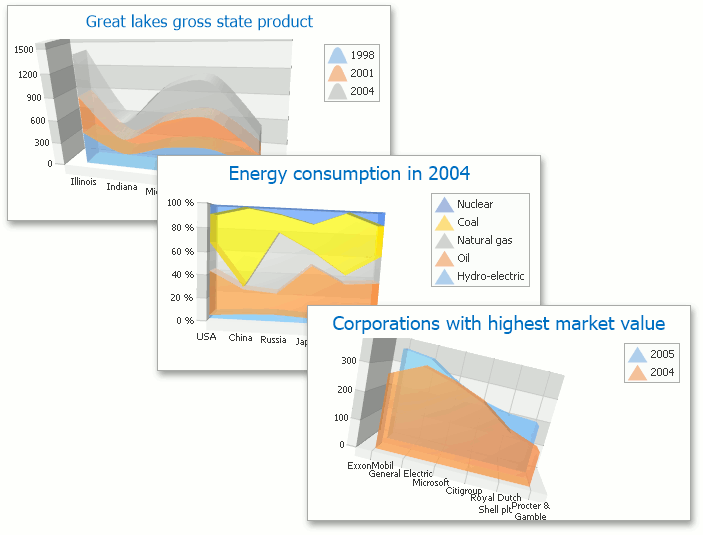
The series of Area view types are used to show filled areas on a diagram. Values are represented by the height of peaks and hollows in the area of each series point. Values can be either used separately (simple areas) or aggregated (stacked and full-stacked areas). The following image represents several 3D area charts.
Below is the list of all area charts, which are currently available in the WinForms Chart Control.


Full-Stacked Spline Area Chart
