Chart Designer for End Users
- 13 minutes to read
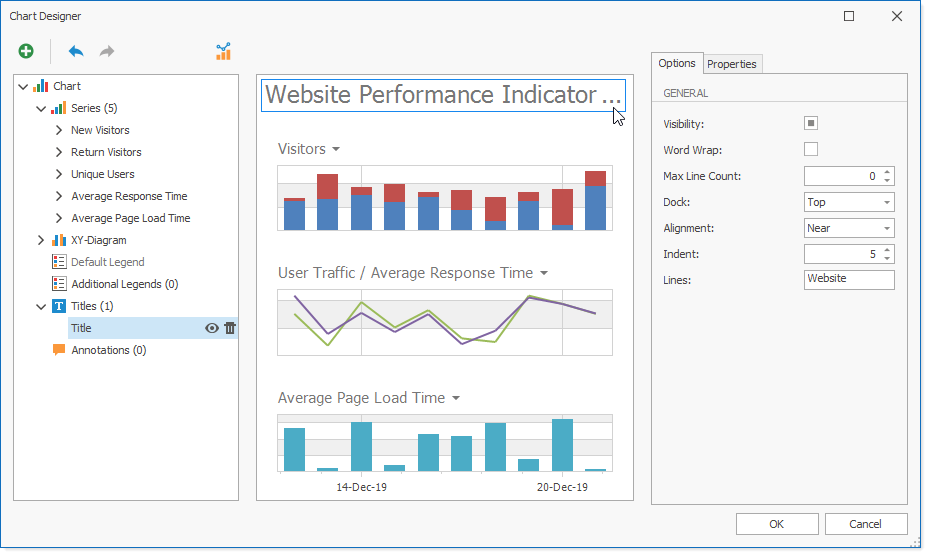
The Chart Designer allows users to customize the chart’s appearance. This topic explains how to invoke and modify the Chart Designer.
This article consists of the following sections:
- Invoke the Chart Designer
- Customize the Chart Designer
- Create a Model for a Custom Chart Element
- Localize the Chart Designer
Invoke the Chart Designer
Create a ChartDesigner class instance and pass a ChartControl that should be customized to the ChartDesigner constructor parameters. Use the ChartDesigner.ShowDialog method to invoke the designer.
Customize the Chart Designer
The following API members allow you to customize the Chart Designer:
- ChartDesigner.Icon
- Gets or sets the Designer form icon.
- ChartDesigner.ShowIcon
- Gets or sets the value indicating whether the Designer form icon should be shown.
- ChartDesigner.ShowActualData
- Specifies whether to use sample data or data from the underlying data source to build a chart for the Chart Designer’s preview.
- ChartDesigner.AddElementMenuOptions
- Returns options of the Add Element menu.
- ChartDesigner.Caption
- Gets or sets the Designer form caption.
- ChartDesigner.EnableLargeDataSetWarning
- Gets or sets the value indicating whether the warning about possible freezes on large data sets should be shown.
- ChartDesigner.AvailableViewTypes
- Gets or sets a list of groups of series views available to show on the chart.
- ChartDesigner.ChartElementHighlighting
- Occurs when chart element highlighting begins.
- ChartDesigner.ChartElementSelecting
- Occurs when chart element selection begins.
- ChartDesigner.ChartStructureUpdating
- Used to customize the Chart Designer Elements’ Tree.
- ChartDesigner.PropertyDescriptorsCustomizing
- Occurs when property descriptor customization required.
ChartDesigner designer = new ChartDesigner(chartControl1);
designer.Icon = new System.Drawing.Icon("../../../Icon.ico", new System.Drawing.Size(32,32));
designer.ShowIcon = true;
designer.AddElementMenuOptions.ShowAddSeriesMenuItem = false;
designer.AddElementMenuOptions.ShowAddSeriesTitleMenuItem = false;
designer.Caption = "Chart Designer";
designer.EnableLargeDataSetWarning = true;
designer.AvailableViewTypes.Clear();
designer.AvailableViewTypes.Add(new ViewTypeGroup("Available Series", new List<ViewType> { ViewType.Area, ViewType.Spline, ViewType.Bar }));

designer.ChartElementHighlighting += OnChartElementHighlighting;
designer.ChartElementSelecting += OnChartElementSelecting;
designer.ChartStructureUpdating += OnChartStructureUpdating;
designer.PropertyDescriptorsCustomizing += OnDesignerPropertyDescriptorsCustomizing;

designer.ShowDialog();

// Handlers for these events are shown below:

private void OnChartStructureUpdating(object sender, ChartStructureChangingEventArgs e) {
    e.ChartModel.Series.AllowAddChild = false;
    foreach(SeriesModel seriesModel in e.ChartModel.Series) {
        seriesModel.AllowChangeVisibility = false;
        seriesModel.AllowRemove = false;
    }
    e.ChartModel.Legends.ShowInStructureControl = false;
}

private void OnChartElementSelecting(object sender, ChartElementSelectingEventArgs e) {
    if(e.ElementModel is SeriesBaseModel) {
        e.Cancel = false;
        return;
    }
    if (e.ElementModel is LegendModel) {
        e.ShowPropertiesTab = false;
        e.ShowDataTab = false;
        e.CustomOptionsControl = new CustomLegendOptionsControl(e.ElementModel);
    }
}

private void OnChartElementHighlighting(object sender, ChartElementHighlightingEventArgs e) {
    SeriesBaseModel series = e.ElementModel as SeriesBaseModel;
    if(series == null) {
        e.Cancel = true;
        return;
    }

}

private void OnDesignerPropertyDescriptorsCustomizing(object sender, PropertyDescriptorsCustomizingEventArgs e) {
    if (e.ElementModel is ChartModel) {
        e.Properties.Remove(e.Properties["BackColor"]);
    }
}
You can use the ChartDesigner.ChartElementSelecting event to replace the control used in the Options tab. The custom control should inherit the DevExpress.XtraCharts.Designer.CustomOptionsControl class. The image below shows a custom Legend Options tab.
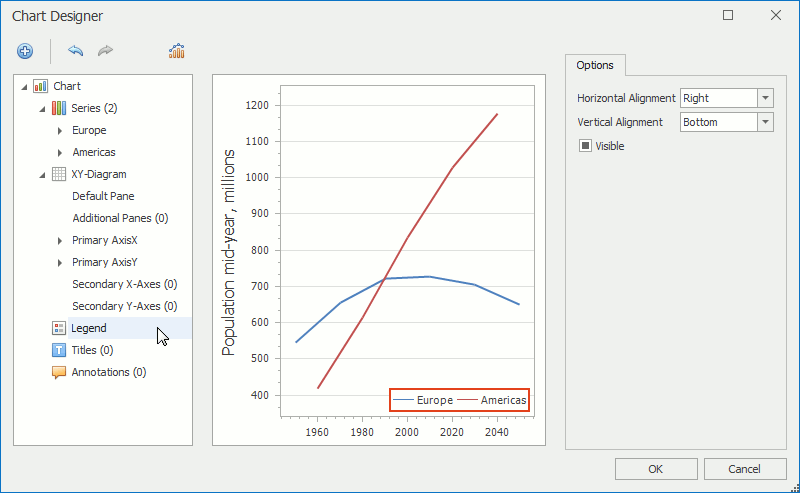
The following code demonstrates how to design the Legend Options tab as shown in the previous image:
#region #CustomOptionsControl
using DevExpress.Utils;
using DevExpress.XtraCharts;
using DevExpress.XtraCharts.Designer;
using System;
using System.Windows.Forms;

namespace CrosshairOptions {
    partial class CustomLegendOptionsControl : CustomOptionsControl {
        bool updateStarted = false;

        LegendModel LegendModel { get { return (LegendModel)this.Model; } }

        public CustomLegendOptionsControl(ChartElementModel model) : base(model) {
            InitializeComponent();
            if(!(model is LegendModel)) throw new ArgumentException("The model must have the LegendModel type.");
        }

        protected override void OnLoad(EventArgs e) {
            base.OnLoad(e);

            var horizontalAlignments = Enum.GetValues(typeof(LegendAlignmentHorizontal));
            cbeHorizontalAlignment.Properties.Items.AddRange(horizontalAlignments);
            var verticvalAlignments = Enum.GetValues(typeof(LegendAlignmentVertical));
            cbeVerticalAlignment.Properties.Items.AddRange(verticvalAlignments);

            UpdateView();
        }

        public override void OnModelUpdated() {
            UpdateView();
        }

        protected void UpdateView() {
            updateStarted = true;
            cbeHorizontalAlignment.SelectedItem = LegendModel.AlignmentHorizontal;
            cbeVerticalAlignment.SelectedItem = LegendModel.AlignmentVertical;
            ceVisible.CheckState = DefaultBooleanToCheckState(LegendModel.Visibility);
            updateStarted = false;
        }

        protected void OnVerticalAlignmentChanged(object sender, EventArgs args) {
            if(!updateStarted)
                LegendModel.AlignmentVertical = (LegendAlignmentVertical)cbeVerticalAlignment.SelectedItem;
        }

        protected void OnHorizontalAlignmentChanged(object sender, EventArgs args) {
            if(!updateStarted)
                LegendModel.AlignmentHorizontal = (LegendAlignmentHorizontal)cbeHorizontalAlignment.SelectedItem;
        }

        protected void OnVisibilityChanged(object sender, EventArgs args) {
            if(!updateStarted)
                LegendModel.Visibility = CheckStateToDefaultBoolean(ceVisible.CheckState);
        }

        protected static CheckState DefaultBooleanToCheckState(DefaultBoolean b) {
            switch(b) {
                case DefaultBoolean.Default: return CheckState.Indeterminate;
                case DefaultBoolean.False: return CheckState.Unchecked;
                case DefaultBoolean.True: return CheckState.Checked;
                default: throw new Exception("The specified DefaultBoolean value is not supported.");
            }
        }

        protected static DefaultBoolean CheckStateToDefaultBoolean(CheckState b) {
            switch(b) {
                case CheckState.Indeterminate: return DefaultBoolean.Default;
                case CheckState.Unchecked: return DefaultBoolean.False;
                case CheckState.Checked: return DefaultBoolean.True;
                default: throw new Exception("The specified CheckState value is not supported.");
            }
        }

    }
}
#endregion #CustomOptionsControl
Create a Model for a Custom Chart Element
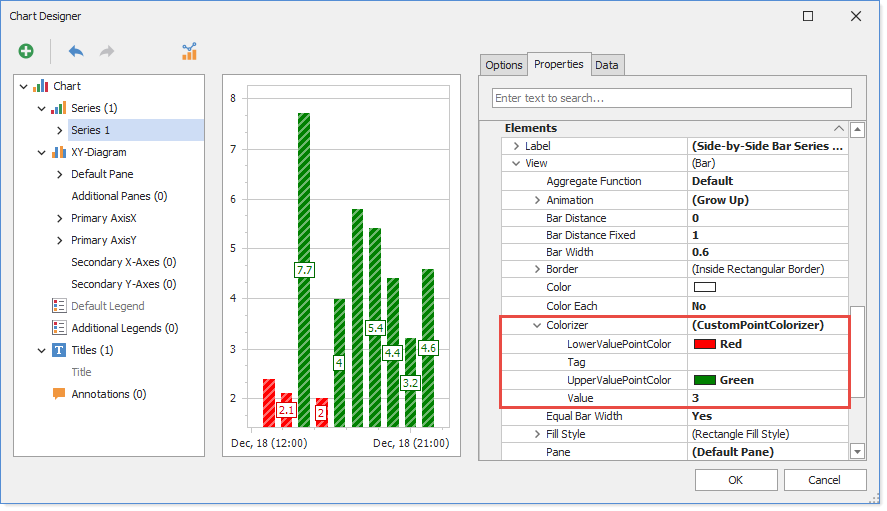
Users configure chart element model properties when they modify chart element properties in the Chart Designer. Model changes apply to a corresponding chart element after the user clicks OK. Models are provided for existing chart elements. If you create a custom element (the colorizer in the example below), you should create and register a model for this element to allow users to edit its options in the Chart Designer.
Example
This example illustrates how to create and register a model (the CustomPointColorizerModel class in this example) for a custom colorizer (the CustomPointColorizer class in this example).
Note
Visit the How to Create a Model for a Custom Chart Element GitHub page to review and download a complete sample project.
Step 1. Create a Model
For example, you have a custom colorizer CustomPointColorizer class that looks as follows:
[TypeConverter(typeof(ExpandableObjectConverter))]
public class CustomPointColorizer : ChartColorizerBase {
    double threshold = 60;
    Color lower = Color.Red;
    Color upper = Color.Green;

    public double Value {
        get { return threshold; }
        set { threshold = value; }
    }
    public Color LowerValuePointColor {
        get { return lower; }
        set { lower = value; }
    }
    public Color UpperValuePointColor {
        get { return upper; }
        set { upper = value; }
    }
    public override Color GetAggregatedPointColor(object argument, object[] values, SeriesPoint[] points, Palette palette) {
        if ((double)values[0] > Value)
            return UpperValuePointColor;
        else
            return LowerValuePointColor;
    }
    public override Color GetPointColor(object argument, object[] values, object colorKey, Palette palette) {
        return Color.Empty;
    }
    protected override ChartElement CreateObjectForClone() {
        return new CustomPointColorizer();
    }
    public override void Assign(ChartElement obj) {
        base.Assign(obj);
        CustomPointColorizer colorizer = obj as CustomPointColorizer;
        if (colorizer != null) {
            Value = colorizer.Value;
            LowerValuePointColor = colorizer.LowerValuePointColor;
            UpperValuePointColor = colorizer.UpperValuePointColor;
        }
    }
    public override string ToString() {
        return "(CustomPointColorizer)";
    }
}
Next, create a CustomPointColorizerModel model for your colorizer. This model is used to modify the colorizer options in the Chart Designer’s Properties tab.
public class CustomPointColorizerModel : ChartColorizerBaseModel {
    CustomPointColorizer MyColorizer { get { return (CustomPointColorizer)Colorizer; } }

    public double Value {
        get { return MyColorizer.Value; }
        set { SetProperty("Value", value); }
    }
    public Color LowerValuePointColor {
        get { return MyColorizer.LowerValuePointColor; }
        set { SetProperty("LowerValuePointColor", value); }
    }
    public Color UpperValuePointColor {
        get { return MyColorizer.UpperValuePointColor; }
        set { SetProperty("UpperValuePointColor", value); }
    }
    public CustomPointColorizerModel(ChartColorizerBase element, CustomModelProvider customModelProvider) : base(element, customModelProvider) {
    }
}
Step 2. Customize the Property Editor
Use the Editor attribute to configure an editor for a Chart Designer property. In this example, you add the CustomPointColorizer item to the list of colorizers for the bar series model’s Colorizer property.
public class SideBySideBarSeriesViewCustomModel : SideBySideBarSeriesViewModel {
    [Editor(typeof(CustomColorizerEditor), typeof(UITypeEditor))]
    public new ChartColorizerBaseModel Colorizer {
        get { return base.Colorizer; }
        set { base.Colorizer = value; }
    }

    public SideBySideBarSeriesViewCustomModel(SideBySideBarSeriesView element, CustomModelProvider customModelProvider)
        : base(element, customModelProvider) {
    }
}

public class CustomColorizerEditor : UITypeEditor {
    IWindowsFormsEditorService editorService;
    public override object EditValue(ITypeDescriptorContext context, IServiceProvider provider, object value) {
        editorService = (IWindowsFormsEditorService)provider.GetService(typeof(IWindowsFormsEditorService));
        var seriesView = context.Instance as SeriesViewBaseModel;

        List<ChartColorizerBase> colorizers = GetColorizers();

        CustomModelProvider modelProvider = new CustomModelProvider();
        modelProvider.RegisterCustomModelType(typeof(CustomPointColorizer), typeof(CustomPointColorizerModel));

        var listBox = new ListBoxControl();
        listBox.Click += listBox_Click;
        listBox.Items.Add("(None)");
        foreach (ChartColorizerBase colorizer in colorizers) {
            var colorizerModel = ModelHelper.GetModel<ChartColorizerBaseModel>(colorizer, modelProvider);
            int index = listBox.Items.Add(colorizerModel);
            if (value != null && colorizerModel.GetType() == value.GetType()) {
                listBox.SelectedIndex = index;
            }
        }
        editorService.DropDownControl(listBox);
        if (listBox.SelectedIndex != 0)
            if (value == null || listBox.SelectedItem.GetType() != value.GetType())
                return listBox.SelectedItem;
            else
                return value;
        else
            return null;
    }
    void listBox_Click(object sender, EventArgs e) {
        this.editorService.CloseDropDown();
    }
    List<ChartColorizerBase> GetColorizers() {
        return new List<ChartColorizerBase>() { new CustomPointColorizer(), new KeyColorColorizer(), new RangeColorizer() };
    }
    public override UITypeEditorEditStyle GetEditStyle(ITypeDescriptorContext context) {
        return UITypeEditorEditStyle.DropDown;
    }
}
Step 3. Register Models
To associate the model with the chart element, use the ChartDesigner.RegisterCustomModelType(System.Type,System.Type) method.
void OnButtonClick(object sender, EventArgs e) {
    ChartDesigner chartDesigner = new ChartDesigner((ChartControl)this.Controls["MyChart"]);
    chartDesigner.RegisterCustomModelType(typeof(CustomPointColorizer), typeof(CustomPointColorizerModel));
    chartDesigner.RegisterCustomModelType(typeof(SideBySideBarSeriesView), typeof(SideBySideBarSeriesViewCustomModel));
    chartDesigner.ShowDialog(true);
}
Localize the Chart Designer
Use one of the following approaches to localize text used in the Chart Designer:
Use Satellite Resource Assemblies (standard localization mechanism).
In this approach, use DevExpress Localization Service to modify or create resource assemblies. To access translations specific to the Chart Designer in the Localization Service, set .NET PLATFORM to WinForms and use one of the following modules:
- XtraCharts.Wizard - Contains resource strings for the Chart Designer’s UI elements, captions, notification messages, and option tabs.
- XtraCharts - Contains resource strings for property names displayed in the Properties tabs.
See Localizing WinForms Controls via Satellite Resource Assemblies for more information.
-
- Create a class that inherits the ChartLocalizer class.
- Override the GetLocalizedString method to return a translation for a resource string with the specified ID. The ChartStringId enum stores all identifiers for strings the Chart Designer uses.
- Initialize the static ChartLocalizer.Active property with the newly created class.
public Form1() { ChartLocalizer.Active = new GermanChartDesignerLocalizer(); InitializeComponent(); } public class GermanChartDesignerLocalizer: ChartLocalizer { public override string Language { get { return "Deutsch"; } } public override string GetLocalizedString(ChartStringId id) { string res = ""; switch (id) { // ... case ChartStringId.SvnArea: return "Fläche"; case ChartStringId.SvnSideBySideBar: return "Säulen"; case ChartStringId.SvnSpline: return "Keil"; // ... default: res = base.GetLocalizedString(id); break; } return res; }See Localizing WinForms Controls via Localizer Objects for more information.