Series Point Colorizer
- 2 minutes to read
The Colorizer defines colors for chart series points and stores them to the SeriesPoint.Color property.
Important
When the Chart Control aggregates series data, the aggregated point has the color that mostly occurs on the aggregated interval.
Apply Colorizer
- Set the SeriesBase.ColorDataMember property to the name of a data member that determines series point colors.
Use the SeriesViewBase.Colorizer property to define a colorizer type. The following colorizers are available:
- ColorObjectColorizer sets color data member values to the SeriesPoint.Color property.
- KeyColorColorizer allows you to select the color based on ColorDataMember values used as key values.
- RangeColorizer allows you to specify value ranges that are colored with the same color.
Color Object Colorizer
This is the default colorizer. You need to specify only the SeriesBase.ColorDataMember property to use it. The ColorDataMember field can contain the following values:
- an integer ARGB color value (431493885);
- three or six digit hex code (#fc0, #ff005d) ;
- a string color name (SkyBlue);
- a Color object.
The image below shows data colorized with colors from a data source:
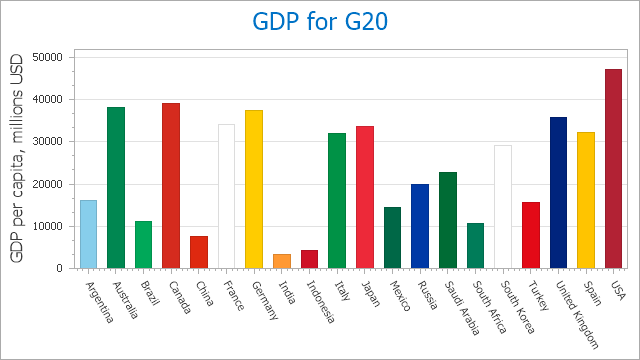
Key-Color Colorizer
Follow the steps below to configure the key-color colorizer.
Fill the KeyColorColorizer.Keys collection.
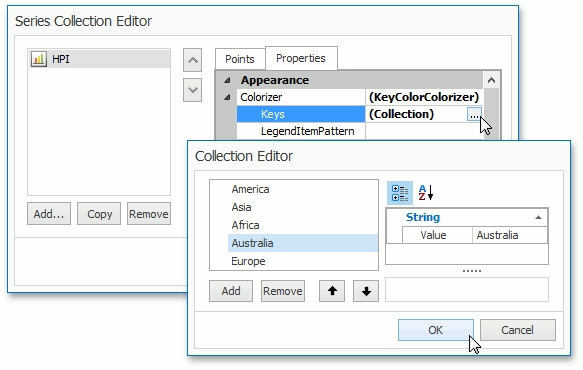
Specify the ChartPaletteColorizerBase.Palette property to use a non-default palette.
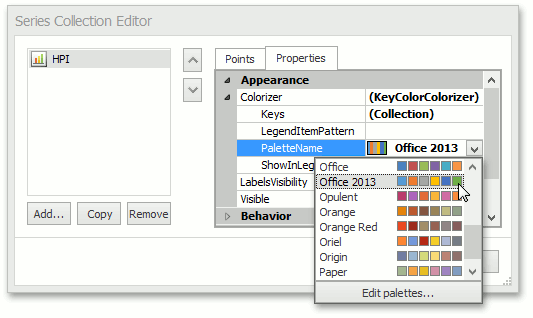
You can use custom logic to assign color keys. Configure the KeyColorColorizer.KeyProvider property for this purpose.
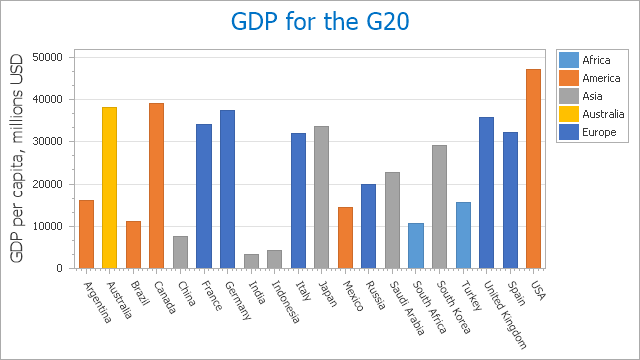
The following image shows a bar chart colorized according to the country’s region:
Note
The following example demonstrates this approach in action: How to: Colorize Charts with Key Color Colorizer.
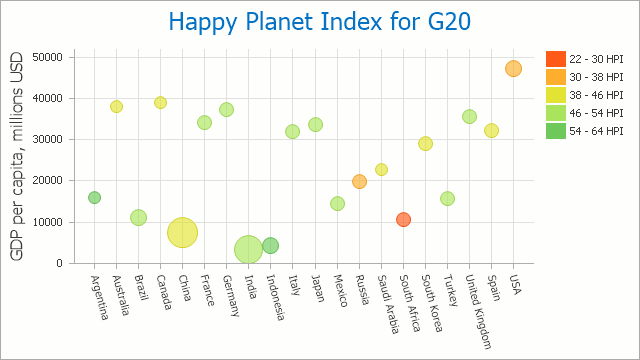
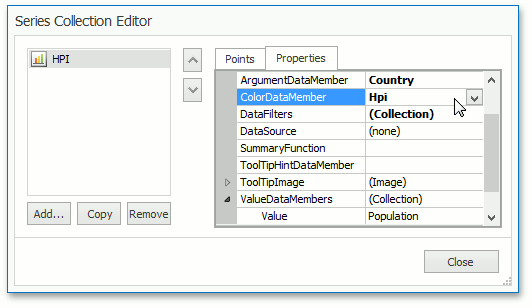
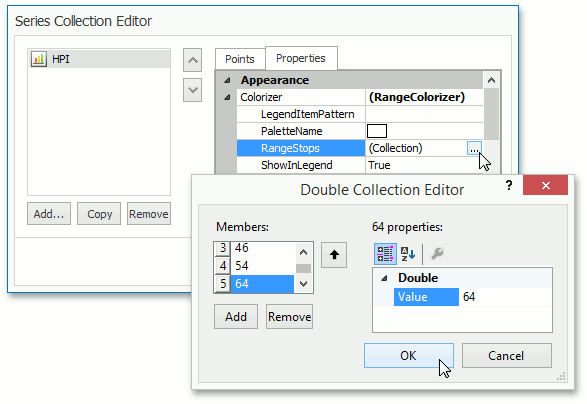
Range Colorizer
Follow the steps below to configure the range colorizer.
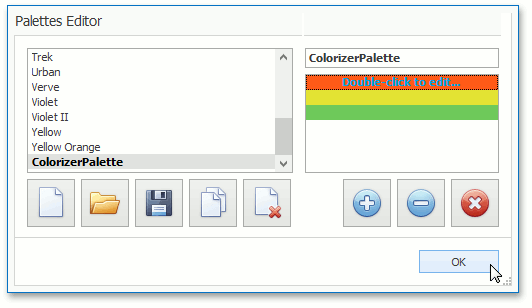
Fill the RangeColorizer.RangeStops collection.
Specify the ChartPaletteColorizerBase.Palette property to use a non-default palette.
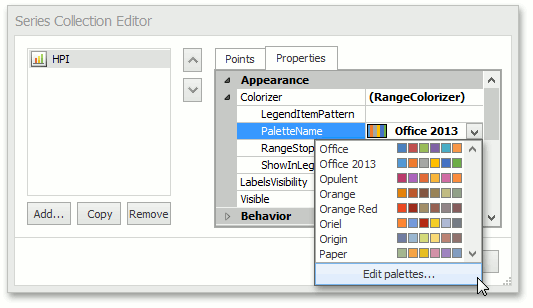
You can use custom logic to provide numeric values based on ColorDataMember values. Specify the RangeColorizer.ValueProvider property for this purpose.
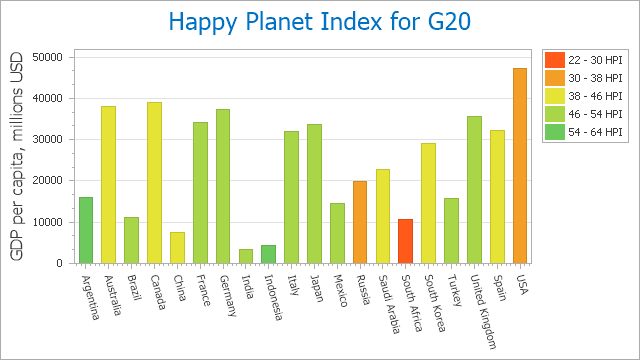
The following image shows a bar chart colorized by the Happy Planet Index:
Note
To view the complete range colorizer example, refer to the following help topic: How to: Colorize Charts Using the Range Colorizer.