Scatter Radar Line Chart
- 3 minutes to read
Short Description
The Scatter Radar Linechart is represented by the ScatterRadarLineSeriesView object, which belongs to Radar Series Views. The series points are displayed in the same order they were added to the collection, without aggregation by the argument. This feature is the main difference between this and other series types, that sort and group points by arguments.
For example, the following image demonstrates a Scatter Radar Line Chart, representing a graph for the Polar Rose function.
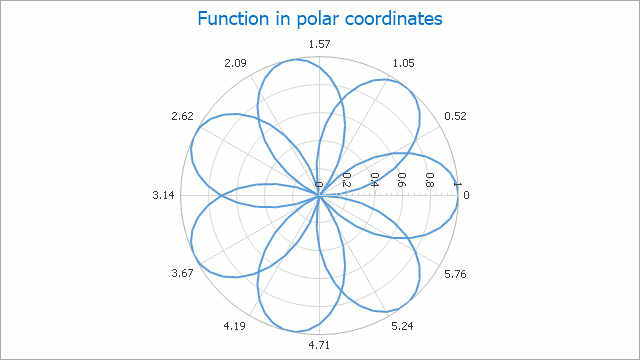
Chart Type Characteristics
The table below lists the main characteristics of this chart type.
| Feature | Value |
|---|---|
| Series View type | ScatterRadarLineSeriesView |
| Diagram type | 2D-RadarDiagram |
| Number of arguments per series point | 1 |
| Number of values per series point | 1 |
Note
- For information on which chart types can be combined with the Scatter Radar Line Chart, refer to the Series Views Compatibility document.
- This series view type is displayed correctly only if scale types of axes are numeric continuous.
Example
The following example demonstrates how to create a Scatter Radar Line Chart chart at runtime.
Note that this series view type is associated with the RadarDiagram type, and you should cast your diagram object to this type in order to access its specific options.
Note
A complete sample project is available at https://github.com/DevExpress-Examples/how-to-create-a-scatter-radar-line-chart-t228800
using DevExpress.Utils;
using DevExpress.XtraCharts;
using System;
using System.Windows.Forms;

namespace ScatterRadarLine {
    public partial class Form1 : Form {
        public Form1() {
            InitializeComponent();
        }

        private void Form1_Load(object sender, EventArgs e) {
            // Create a new chart.
            ChartControl scatterRadarLineChart = new ChartControl();

            // Add the chart to the form.
            scatterRadarLineChart.Dock = DockStyle.Fill;
            this.Controls.Add(scatterRadarLineChart);

            // Create a scatter radar line series.
            Series series1 = new Series("Series 1", ViewType.ScatterRadarLine);

            // Add points to it.
            series1.Points.Add(new SeriesPoint(2.58308729295161, 2.92389013581495));
            series1.Points.Add(new SeriesPoint(2.72271363311115, 1.60362130049876));
            series1.Points.Add(new SeriesPoint(2.8623399732707, 0.916511826809461));
            series1.Points.Add(new SeriesPoint(3.00196631343025, 0.426951214001806));
            series1.Points.Add(new SeriesPoint(3.14159265358979, 3.67381906146713E-16));
            series1.Points.Add(new SeriesPoint(0.15707963267949, 0.479172332020966));
            series1.Points.Add(new SeriesPoint(0.36651914291880, 1.16748565197914));
            series1.Points.Add(new SeriesPoint(0.575958653158129, 1.82356171354251));
            series1.Points.Add(new SeriesPoint(0.785398163397448, 2.12132034355964));
            series1.Points.Add(new SeriesPoint(0.994837673636768, 1.82356171354251));
            series1.Points.Add(new SeriesPoint(1.20427718387609, 1.16748565197914));
            series1.Points.Add(new SeriesPoint(1.41371669411541, 0.479172332020967));
            series1.Points.Add(new SeriesPoint(4.74729556542458, 0.10483062990165));
            series1.Points.Add(new SeriesPoint(5.02654824574367, 1.06132878657975));
            series1.Points.Add(new SeriesPoint(5.23598775598299, 2.47662710943896));
            series1.Points.Add(new SeriesPoint(5.27089434102288, 2.92389013581494));

            // Add the series to the chart.
            scatterRadarLineChart.Series.Add(series1);

            // Flip the diagram (if necessary).
            ((RadarDiagram)scatterRadarLineChart.Diagram).StartAngleInDegrees = 10;
            ((RadarDiagram)scatterRadarLineChart.Diagram).RotationDirection =
                   RadarDiagramRotationDirection.Clockwise;

            // Access the view-type-specific options of the series.
            ((ScatterRadarLineSeriesView)series1.View).LineStyle.DashStyle = DashStyle.Dot;

            // Hide the legend (if necessary).
            scatterRadarLineChart.Legend.Visibility = DefaultBoolean.False;

            // Add a title to the chart (if necessary).
            scatterRadarLineChart.Titles.Add(new ChartTitle());
            scatterRadarLineChart.Titles[0].Text = "A Scatter Radar Line Chart";
        }
    }
}