How to: Create an Interactive Drill-Down Report
- 4 minutes to read
This document explains the creation of a tree-like report structure, implemented in the XtraPrinting demo Master-Detail application.
This demo creates a report using a custom CreateReport procedure with whose data is obtained from the nwind.mdb database. The main report page contains data from the “Customers” table. The report is displayed in the custom MyPrintControl control derived from the PrintControl class. This control is placed onto the tab page of the tab control named PSTab. The application form also contains the standard Print Preview Menu and Toolbar, provided by the PrintBarManager component, which is linked to a MyPrintControl instance. The drill-down function is invoked by clicking the book icon, indicated by a changed mouse cursor. The report preview is demonstrated in the following image:
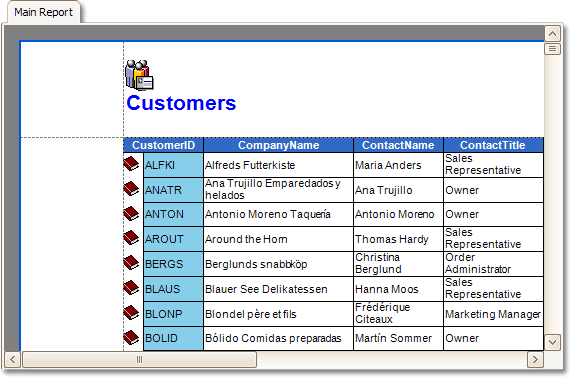
During report creation, icons for displaying row state (collapsed or expanded) in the master report are drawn using the BrickGraphics.DrawImage method of the BrickGraphics class. The Brick.ID value of these bricks is assigned to the “CustomerID” field value of the corresponding row, and the Brick.Value property value of these bricks contains a flag, determining record state: 0 - if the master row is collapsed, and 1 - if expanded. The MyPrintControl class provides a ChangeBrickClick event, which uses the PrintControl.BrickClick event to handle user clicks.
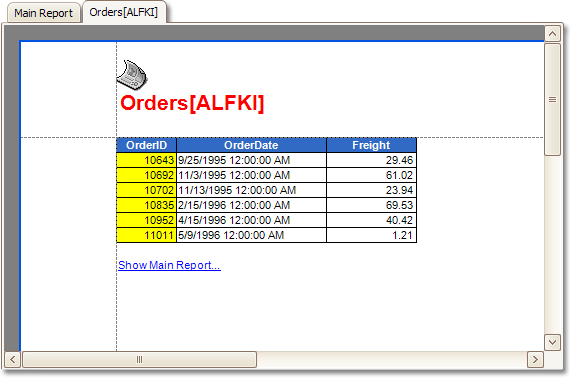
Clicking the closed book icon near the Customer ID column adds a new tab to the PSTab control, and changes the row state icon to an open book image and creates a new report within that tab. This report contains data from the “Orders” table.
That data is obtained from the rows where the “CustomerID” field value equals the Brick.ID property value of the clicked ImageBrick. If the row corresponding to the clicked icon has already been expanded, then clicking that icon removes the tab with a specific report and changes the icon to a closed book image.
These actions are performed in the ChangeClickBrick event handler. The code for this handler is shown below. For the complete application code refer to Master-Detail demo of XtraPrinting Library.
private void ChangeClickBrick(object sender, EventArgs e) {
    Brick brick = sender as Brick;

    if(brick.Value.Equals("Main")) {
        PSTab.SelectedTabPageIndex = 0;
        return;
    }

    // Change the icon and flag.
    int i = brick.Value.Equals(0) ? 1 : 0;
    brick.Value = i;
    ((ImageBrick)brick).Image = imageList1.Images[i];

    // Redraw an ImageBrick, indicating the row state.
    pc.InvalidateBrick(brick);
    // Name the new tab header.
    string tpName = "Orders[" + brick.ID + "]";

    // Check whether the row is expanded.
    if(i == 1) {

       // Add a new tab.
        XtraTabPage tp = new XtraTabPage();
        tp.Text = tpName;
        tp.Tag = brick.ID;
        PSTab.TabPages.Add(tp);

        // Add a new MyPrintControl instance to the tab page.
        PrintingSystem ps = new PrintingSystem();
        ps.SetCommandVisibility(PrintingSystemCommand.ClosePreview, CommandVisibility.None);
        MyPrintControl pcNew = new MyPrintControl();
        pcNew.ChangeClickBrick += new EventHandler(ChangeClickBrick);
        pcNew.Dock = DockStyle.Fill;
        pcNew.PrintingSystem = ps;
        tp.Controls.Add((System.Windows.Forms.Control)pcNew);

        // Get the data and create a new report.
        dv = CreateDataView("Orders", " WHERE [CustomerID] ='" + brick.ID + "'");
        CreateReport(ps, dv, wCustomers, sOrders, null, 0, tpName, imageList2.Images[1]);

        // Move focus to a new tab.
        PSTab.SelectedTabPageIndex = FindTabPageIndex(tpName, PSTab);

    } else {
        // If the row is collapsed, remove the tab page and switch to the main report.
        PSTab.TabPages.RemoveAt(FindTabPageIndex(tpName, PSTab));
        PSTab.SelectedTabPageIndex = 0;
    }
}
When the row state icon is clicked, a new tab with a report preview is created, as illustrated in the following picture:
You may use similar approach to create reports that provide the drill-down functionality.