Colorizers
- 3 minutes to read
This document introduces the Map Colorizer, lists colorizer types, and explains how to create a colorizer and customize its settings.
The document consists of the following sections.
Overview
The Colorizer is used to automatically choose colors for map shapes based on shape data. This feature can be applied to the following MapShape class descendants that utilize the MapShape.Fill property:
For example, you can use the map colorizer to create GDP, population or political maps.
Before using this feature, perform the following steps.
- Provide vector data which will be colorized. To learn how to do this, refer to the Providing Data examples section.
Choose which colorizer type is going to be used in your application.
-
Represents the Graph colorizer, which paints shapes that have a common border using different colors according to the Graph Coloring approach. For instance, the Graph colorizer can be used to create a political map.
Note
Note colorize data loaded from a KML file only possible using a graph colorizer.
-
Represents the Choropleth colorizer, which shows statistical data over predefined regions (such as counties or states) by coloring or shading these regions.
Then, assign the selected colorizer type object to the MapControl.Colorizer property.
-
After that, it is possible to customize the map colorizer settings. The sections below describe how this can be done.
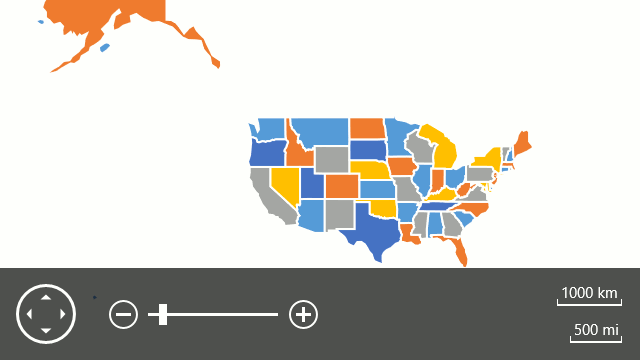
Graph Colorizer
To colorize map contours using this colorizer, specify the collection of colors used by the colorizer. To do this, use the MapColorizer.Colors property. The following XAML demonstrates this.
Note
A complete sample project is available at: https://github.com/DevExpress-Examples/how-to-load-vector-data-from-a-kml-file-t279977
<Map:MapControl.Colorizer>
    <Map:GraphColorizer>
        <Map:GraphColorizer.Colors>
            <Color>#5b9bd5</Color>
            <Color>#ed7d31</Color>
            <Color>#a5a5a5</Color>
            <Color>#ffc000</Color>
            <Color>#4472c4</Color>
            <Color>#70ad47</Color>
        </Map:GraphColorizer.Colors>
    </Map:GraphColorizer>
</Map:MapControl.Colorizer>
As a result, the map shapes appear as follows.
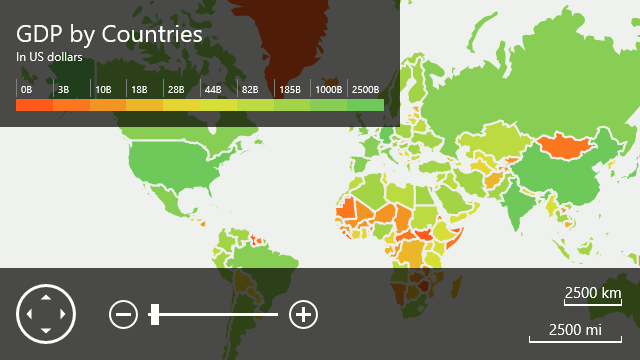
Choropleth Colorizer
To colorize map contours using this colorizer, it is necessary to specify the ChoroplethColorizer.RangeStops collection and the ChoroplethColorizer.ValueProvider property (to access required information associated with shapes) in addition to the MapColorizer.Colors collection. Also, it is possible to use legends for this colorizer. The following XAML demonstrates this.
Note
A complete sample project is available at: https://github.com/DevExpress-Examples/how-to-load-vector-data-from-shapefile-t279980
<Map:MapControl.Colorizer>
    <Map:ChoroplethColorizer
        RangeStops="0 3000 10000 18000 28000 44000 82000 185000 1000000 2500000 15000000">
        <Map:ChoroplethColorizer.ValueProvider>
            <Map:ShapeAttributeValueProvider AttributeName="GDP_MD_EST"/>
        </Map:ChoroplethColorizer.ValueProvider>
        <Map:ChoroplethColorizer.Colors>
            <Color>#FFFF5A19</Color>
            <Color>#FFE5E335</Color>
            <Color>#FF6EC95C</Color>
        </Map:ChoroplethColorizer.Colors>
        <Map:ChoroplethColorizer.Legend>
            <Map:ColorScaleLegend Margin="0" Header="GDP by Countries" Description="In US dollars"
                                  RangeStopsFormat="0,B" MinWidth="400" FontSize="10"/>
        </Map:ChoroplethColorizer.Legend>
    </Map:ChoroplethColorizer>
</Map:MapControl.Colorizer>
As a result, the map shapes appear as follows.