Series.Visible Property
Gets or sets whether the series is visible.
Namespace: DevExpress.Xpf.Charts
Assembly: DevExpress.Xpf.Charts.v23.2.dll
NuGet Package: DevExpress.Wpf.Charts
Declaration
Property Value
| Type | Description |
|---|---|
| Boolean | true if the series is visible; otherwise, false. |
Remarks
Use the Visible property to show or hide all the points belonging to this series.
Example
This example demonstrates how to display a chart title as a group of checkboxes that control series visibility.
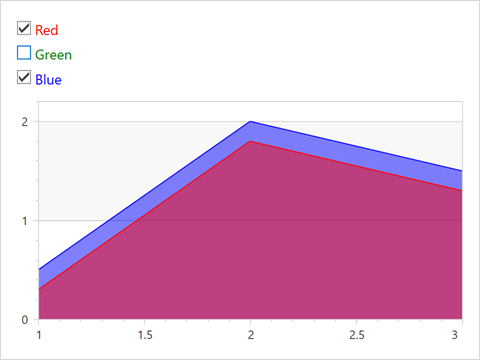
- Define a WrapPanel with a set of CheckBox elements.
- Bind their check state to the
Series.Visibleproperty of the corresponding series. - Add this WrapPanel as a chart title to the ChartControlBase.Titles collection.
Note
You can also use legend checkboxes to manage series visibility.
<Window x:Class="CustomChartTitles.MainWindow"
        xmlns="http://schemas.microsoft.com/winfx/2006/xaml/presentation"
        xmlns:x="http://schemas.microsoft.com/winfx/2006/xaml"
        xmlns:dxc="http://schemas.devexpress.com/winfx/2008/xaml/charts"
        Title="Custom Chart Titles" Height="380" Width="650">
    <Grid>
        <dxc:ChartControl Name="chart">
            <dxc:ChartControl.Titles>
                <dxc:Title>
                    <WrapPanel Orientation="Vertical">
                        <CheckBox Name="chRed" Foreground="Red" IsChecked="True" FontSize="14">
                            Red
                        </CheckBox>
                        <CheckBox Name="chGreen" Foreground="Green" IsChecked="True" FontSize="14">
                            Green
                        </CheckBox>
                        <CheckBox Name="chBlue" Foreground="Blue" IsChecked="True" FontSize="14">
                            Blue
                        </CheckBox>
                    </WrapPanel>
                </dxc:Title>
            </dxc:ChartControl.Titles>
            <dxc:ChartControl.Diagram>
                <dxc:XYDiagram2D>
                    <dxc:XYDiagram2D.AxisX>
                        <dxc:AxisX2D>
                            <dxc:AxisX2D.Range>
                                <dxc:AxisRange SideMarginsEnabled="False" />
                            </dxc:AxisX2D.Range>
                        </dxc:AxisX2D>
                    </dxc:XYDiagram2D.AxisX>
                    <dxc:XYDiagram2D.Series>
                        <dxc:AreaSeries2D Name="Blue" Brush="Blue" Transparency="0.5"
                                          Visible="{Binding ElementName=chBlue, Path=IsChecked}">
                            <dxc:AreaSeries2D.Points>
                                <dxc:SeriesPoint Argument="1" Value="0.5" />
                                <dxc:SeriesPoint Argument="2" Value="2" />
                                <dxc:SeriesPoint Argument="3" Value="1.5" />
                            </dxc:AreaSeries2D.Points>
                            <dxc:AreaSeries2D.Label>
                                <dxc:SeriesLabel Visible="False" />
                            </dxc:AreaSeries2D.Label>
                        </dxc:AreaSeries2D>
                        <dxc:AreaSeries2D Name="Red" Brush="Red" Transparency="0.5"
                                          Visible="{Binding ElementName=chRed, Path=IsChecked}">
                            <dxc:AreaSeries2D.Points>
                                <dxc:SeriesPoint Argument="1" Value="0.3" />
                                <dxc:SeriesPoint Argument="2" Value="1.8" />
                                <dxc:SeriesPoint Argument="3" Value="1.3" />
                            </dxc:AreaSeries2D.Points>
                            <dxc:AreaSeries2D.Label>
                                <dxc:SeriesLabel Visible="False" />
                            </dxc:AreaSeries2D.Label>
                        </dxc:AreaSeries2D>
                        <dxc:AreaSeries2D Name="Green" Brush="Green" Transparency="0.5"
                                          Visible="{Binding ElementName=chGreen, Path=IsChecked}">
                            <dxc:AreaSeries2D.Points>
                                <dxc:SeriesPoint Argument="1" Value="0.1" />
                                <dxc:SeriesPoint Argument="2" Value="1.6" />
                                <dxc:SeriesPoint Argument="3" Value="1.1" />
                            </dxc:AreaSeries2D.Points>
                            <dxc:AreaSeries2D.Label>
                                <dxc:SeriesLabel Visible="False" />
                            </dxc:AreaSeries2D.Label>
                        </dxc:AreaSeries2D>
                    </dxc:XYDiagram2D.Series>
                </dxc:XYDiagram2D>
            </dxc:ChartControl.Diagram>
        </dxc:ChartControl>
    </Grid>
</Window>
See Also